Your Internal Product Has a Marketing Problem. Here Is How to Fix It.
What this article covers: how to apply the full Marketing Canvas Method to an internal product or programme — with your colleagues as customers, their workarounds as competitors, and adoption rate as your revenue metric.
The three critical inputs that determine your entire strategy:
- M3 — Growth Curve: the adoption stage of your Lead Segment right now (Introduction · Growth · Maturity · Decline)
- M4 — Economic Value: the type of value your product actually delivers (Commodity · Products · Services · Experience)
- Revenue Lever: the primary adoption problem (Acquisition · Retention · Stimulation)
These three inputs unlock your Strategic Archetype, which determines the 10 Vital 8 dimensions you score — and nothing more. The archetype filters the 24 dimensions to the 10 that are decisive for your situation.
The sequence that fixes adoption failure: FIX the Fatal Brakes before any campaign or rollout. ALIGN your Primary Accelerators. SCALE to secondary segments only after your Lead Segment adoption goal is confirmed. Never reverse the order.
You shipped the platform. You ran the training sessions. You sent the all-hands announcement. Three months later, 70% of the target department is still using the old process. Your budget owner is asking questions you can't answer. And your next release is scheduled for Q3.
What you are facing is not a training problem. It is not a communication problem. It is a marketing problem — and the Marketing Canvas Method gives you a structured six-step diagnostic to solve it.
The logic is the same as external marketing. Your internal users are customers. Their workarounds are your competitors. Their time and disruption cost is your price. Their productivity gain is your value proposition. Every concept in the method translates directly. What changes is not the logic — it is the vocabulary.
This article walks you through how to apply the method to an internal product or programme. By the end, you will have a clear sequence: one target segment, one adoption goal, an archetype that determines your 10 priority dimensions, and a FIX → ALIGN → SCALE roadmap that sequences what to fix before you run any campaign.
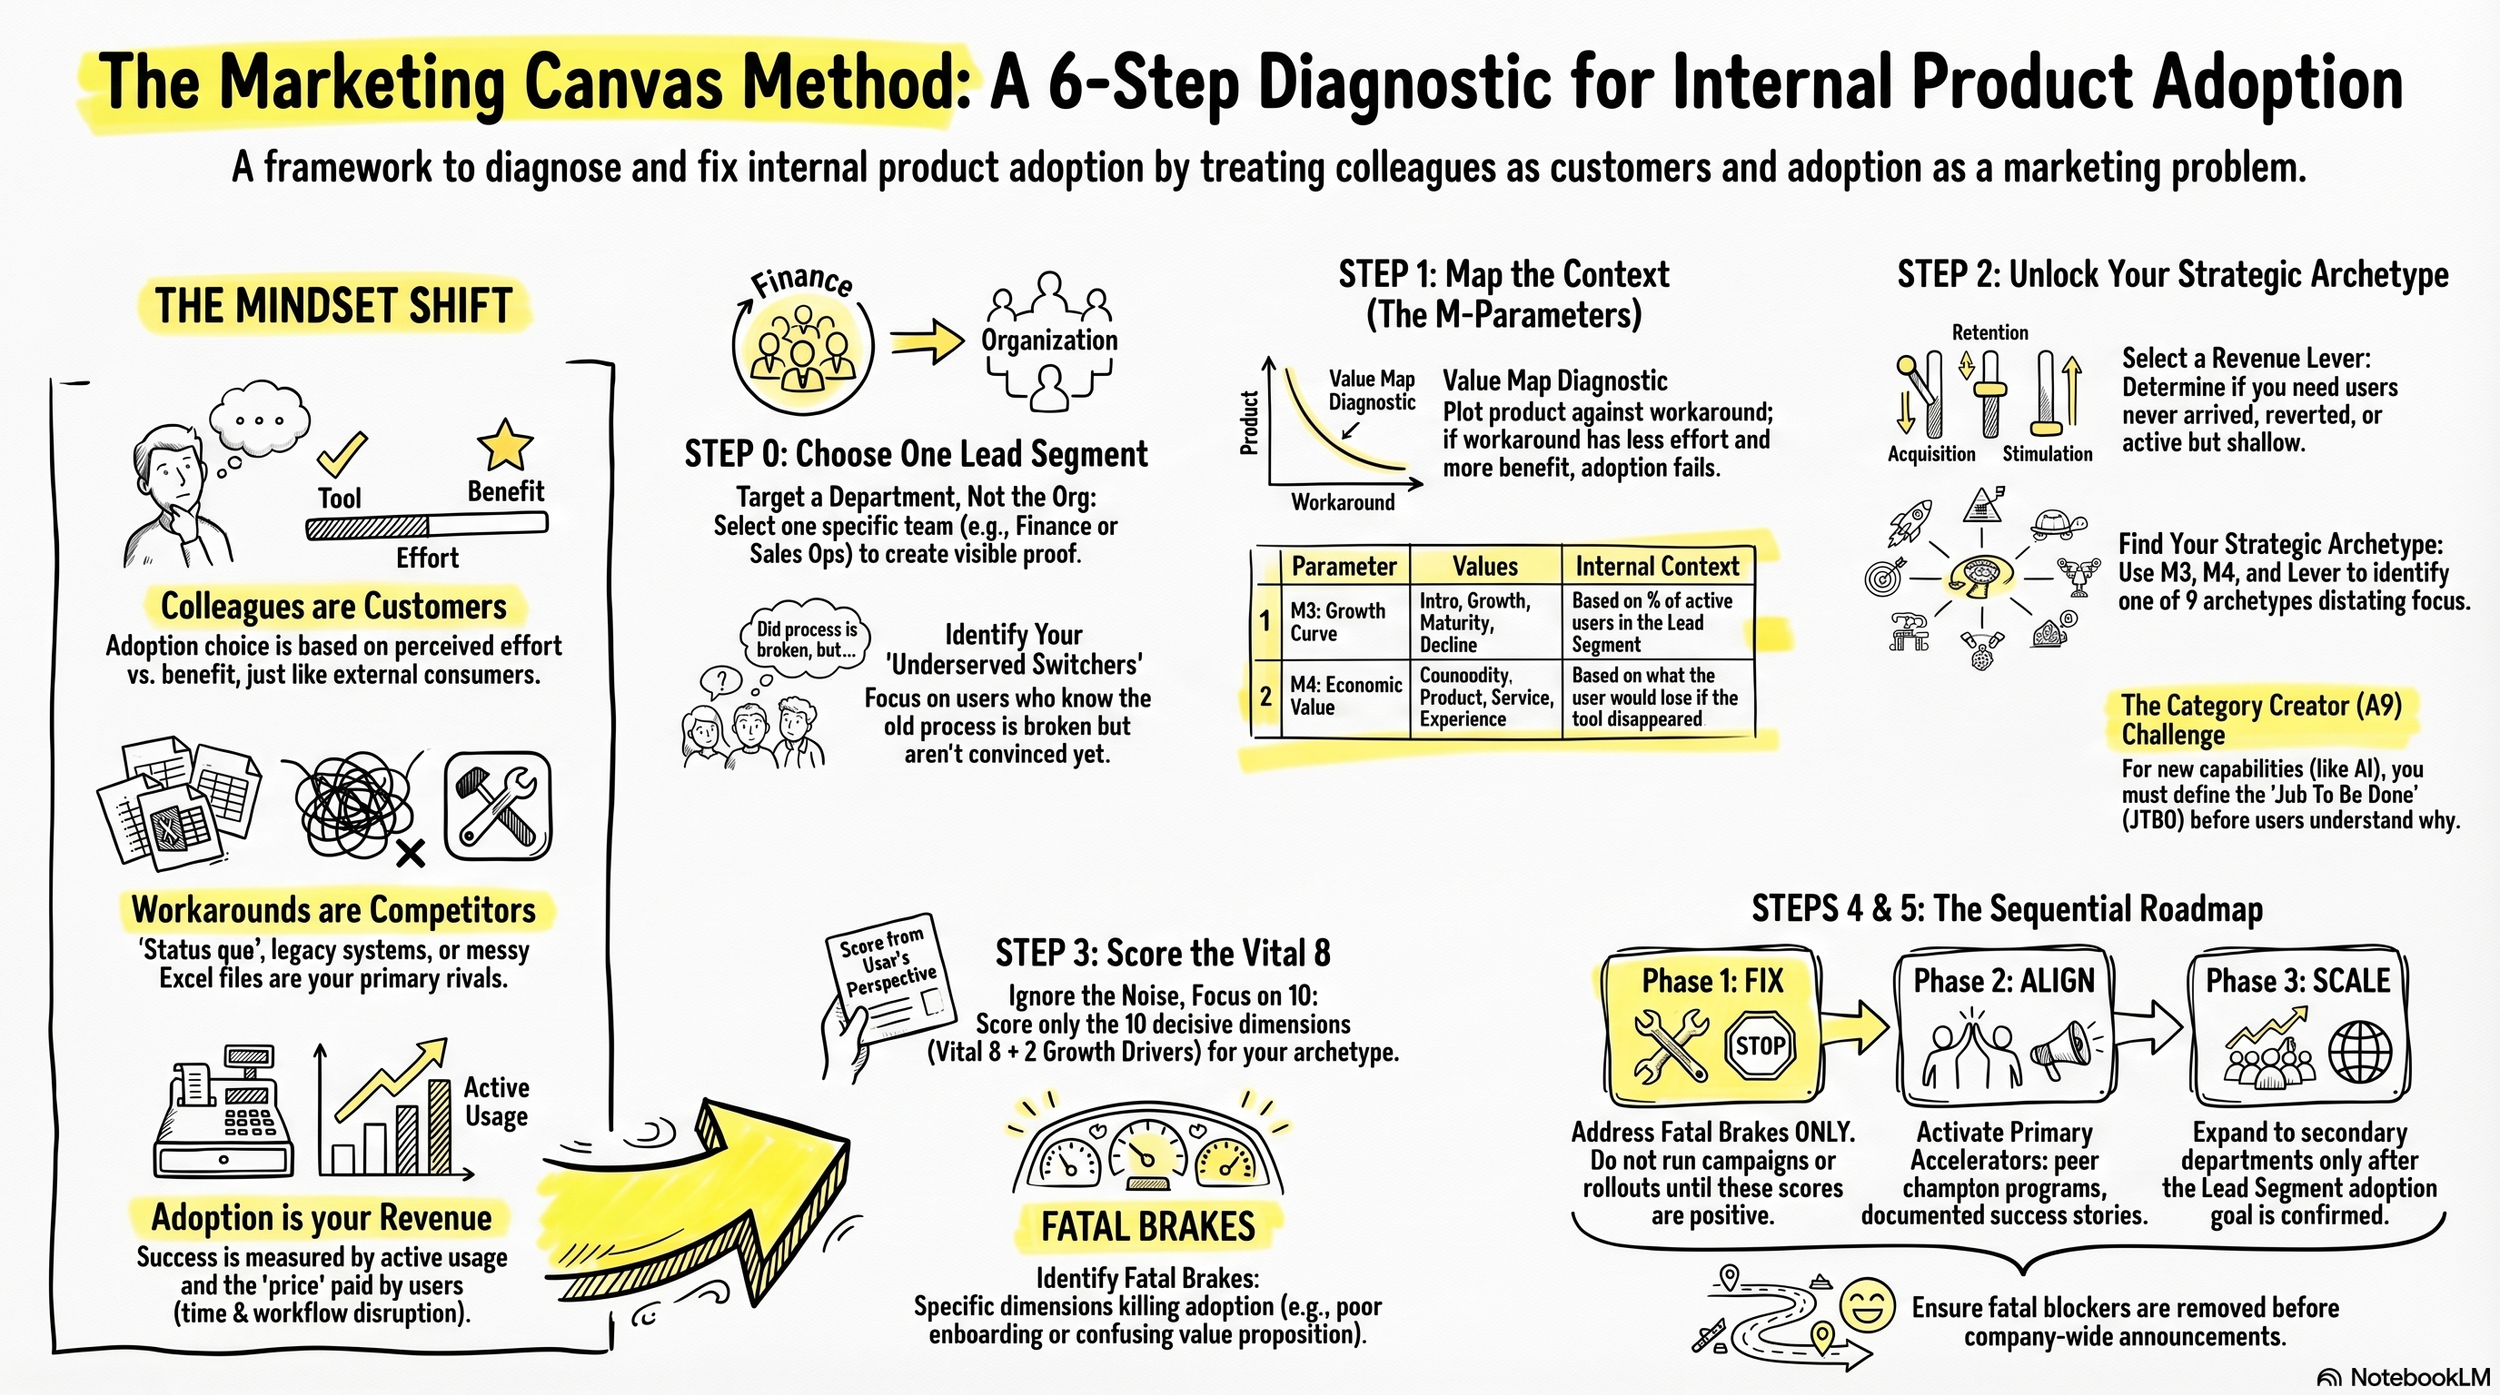
The Marketing Canvas Method: A 6-step Diagnostic for internal product adoption
Step 0 — Choose One Department. Not the Whole Organisation.
The most common strategic error in internal product launches is targeting everyone simultaneously. When you design for all 600 employees at once, you produce a strategy that is average for all of them and compelling for none.
You should identify the one internal segment where getting adoption right first creates the most visible proof for the rest of the organisation. Ask yourself one question: whose adoption, if it succeeded and was visible, would pull the other departments in without a second campaign?
That is your Lead Segment (Step 0 — Lead Segment Junction). It is one department, one role type, one team. Not a persona. A specific, nameable group of people with a shared job and a shared pain.
Once you have named it, classify it. Four internal customer types determine your entire strategy:
You have users who know the old process is broken but are not yet convinced your product is better. These are your Underserved Switchers. They want to move. They need one specific, low-friction reason to try it this week. This is the highest-leverage Lead Segment in most internal launches.
You have users who are deeply embedded in the legacy system and whose professional identity is tied to it. These are your Legacy Anchors. Pushing them harder will not work. Focus on a different segment first. Let social proof do the work on this group later.
You have users who are already using the product partially but have not gone all in. These are your Under-Optimised Power Users. Remove the one integration gap or permission blocker that is stopping them from going deeper and they activate immediately.
You have users who already believe in the product and are talking about it positively. These are your Early Believers. They are too few to move the adoption number alone, but their stories are the most credible asset you have.
You should select your Lead Segment before you open the canvas. Everything from Step 1 onwards is assessed from their perspective — not the organisation's.
Step 1 — Map the Context for Your Lead Segment
Step 1 produces ten parameters (M1 through M10) that describe the competitive and contextual reality your Lead Segment is operating in. Every parameter has an internal equivalent. The table below shows you how to read each one in an organisational context rather than a market context.
| M Parameter | External | Internal Equivalent |
|---|---|---|
| M1 Market Definition | Industry category | Organisational scope — who the product is designed to serve |
| M2 Key Benefits | Functional, emotional, strategic | Time saved, risk reduced, status gained, friction removed |
| M3 Growth Curve | Market lifecycle | Adoption lifecycle within the Lead Segment: Introduction → Growth → Maturity → Decline |
| M4 Economic Value | Commodity → Experience | Compliance tool → Productivity tool → Strategic enabler |
| M5 Market Sizing | TAM / SAM | Total addressable headcount × estimated value per active user |
| M6 Competitors | External rivals | Status quo, Excel workarounds, external SaaS alternatives, rival internal tools |
| M7–M9 Value Map | Price vs. benefits | Perceived effort to adopt vs. perceived benefit delivered — score both your product and the workaround |
| M10 Trends | Market forces | Org restructuring, budget cycles, leadership mandates, active digital transformation programmes |
The Value Map (M7–M9) is the most powerful diagnostic tool at this stage. Most internal products fail not because they are bad products, but because the perceived effort to adopt (M8 equivalent) is high and the perceived benefit (M9 equivalent) is low — from the user's perspective, even when the tool is strategically correct for the organisation. Plot your product and the workaround it is meant to replace on the same map. If the workaround sits at lower perceived effort and higher perceived benefit, you have your diagnosis before you score a single dimension.
Two of these parameters are the most critical inputs in the entire method: M3 and M4. Get them wrong and your archetype will be wrong, your Vital 8 will be wrong, and your roadmap will prescribe solutions to a problem you have not correctly diagnosed.
M3 — Growth Curve: Assign the Adoption Stage
M3 answers: where is your Lead Segment on the adoption lifecycle right now?
You should assign one of four canonical values: Introduction, Growth, Maturity, or Decline. Do not create new values. Do not average across departments. Assign M3 for your Lead Segment only, based on two questions: what percentage of the segment is actively using the product today, and is that number growing, flat, or falling?
| What you observe in the Lead Segment | M3 Value | Strategic signal |
|---|---|---|
| Fewer than 20% of the segment have ever actively used the product | Introduction | The job and the product are both unknown. JTBD (110) and Positioning (220) are the critical dimensions before anything else. |
| 20–60% active; usage growing month over month | Growth | Adoption is spreading but shallow. Experience (420) and onboarding determine whether it holds. |
| Usage plateaued — growth stopped despite untapped potential in the segment | Maturity | You are competing with the installed workaround. Retention, not acquisition, is the strategic question. |
| Active usage declining — users reverting to legacy methods | Decline | The product lost the adoption battle in this segment. A new feature release will not fix this. |
The most common M3 error: assigning Growth because the product was launched and communicated, not because adoption data confirms it. A product that was announced to 800 people and is actively used by 60 is in Introduction, not Growth. The announcement is not the market. The active users are.
M4 — Economic Value: Assign the Value Type
M4 answers: what is the actual nature of the value your product delivers to the Lead Segment user?
You should assign one of four canonical values: Commodity, Products, Services, or Experience. This is the parameter most internal product owners get wrong — because they assign M4 based on the sophistication of the technology rather than the value the user actually receives.
To assign M4 correctly, ask one question: what would the Lead Segment lose if your product disappeared tomorrow?
"We would have to do the process manually" → Commodity
"We would lose the output — the report, the dashboard, the record" → Products
"We would lose the tailored insight — it adapts to our team's specific context" → Services
"We would lose a way of working — the product changed how we make decisions" → Experience
| What the product delivers to the user | M4 Value | Internal example |
|---|---|---|
| Compliance and standard process execution — all users use it identically; value is in adherence to the standard | Commodity | Expense reporting tool, time-tracking system, mandatory safety checklist app |
| Defined functional output — specific features produce measurable results; value is the output, not the interaction | Products | CRM, project management board, BI reporting dashboard |
| Customised outcomes — the product adapts to the team's context and delivers tailored results; value is the outcome, not the feature | Services | Data analytics platform, AI assistant with configurable workflows, strategic planning tool |
| Transformative interaction — the product changes how the team works; the interaction itself creates value beyond any single output | Experience | Collaboration environment that restructures team communication, platforms that shift how decisions are made |
You should be honest. Most internal platforms positioned as Experience are actually Services or Products in the user's experience. An inflated M4 produces a mismatched archetype and a strategy that wastes the next quarter.
M8 — Perceived Price: Score the Adoption Cost
M8 is not a budget figure. In an internal context, M8 is the total perceived cost of adoption from the Lead Segment user's perspective: time to learn the new system, disruption to current workflows, integration friction with tools they have open every day, and the political risk of being an early adopter if the product fails.
You should score M8 honestly. Most internal products score between −3 and −6 on launch day. That score is not a failure — it is the diagnostic. If your M8 is high and your M9 (perceived benefit) is low, you do not have a communication problem. You have a positioning crisis. No training session fixes a −5 M8 score. A redesigned onboarding experience and a one-sentence JTBD statement might.
You should also map your competitors at this stage. The most common facilitation error in internal marketing is refusing to name the competition. Status quo is always a competitor. The Excel file your Finance team has been using for four years is a competitor. Map it on the Value Map. If it sits at higher perceived benefit and lower perceived adoption cost than your product, you now know exactly what you are solving before you design a single initiative.
Step 2 — Define Your Adoption Goal and Unlock the Archetype
Step 2 produces three outputs: a primary revenue lever, a SMART adoption goal, and a Strategic Archetype. You need all three before you score any dimensions. The archetype determines which 10 dimensions you score in Step 3. Without it, you are scoring 24 dimensions with no filter — which produces a comprehensive analysis that prioritises nothing.
Phase A — Select the Revenue Lever
You should diagnose the correct lever before setting any goal. Three levers. One primary. The selection follows from your adoption data, not from your ambition.
| What the data shows | Lever | Internal translation |
|---|---|---|
| Fewer than 40% of the Lead Segment have ever actively used the product | Acquisition (GET) | The primary problem is reach — users have never arrived |
| Users tried it and reverted — active usage is declining | Retention (KEEP) | The primary problem is churn back to old methods |
| Users are active but using fewer than 30% of available capability | Stimulation (GROW) | The primary problem is depth of use, not volume |
The diagnostic question that determines the lever: "Are my users leaving, or have they never arrived?"
If fewer than 40% of your Lead Segment have ever actively used the product, your lever is Acquisition. The problem is reach and awareness. A campaign is appropriate — but only after you have confirmed the JTBD is clear and the experience is working.
If users adopted in a previous cycle and reverted, your lever is Retention. You do not have an awareness problem. You have a churn-back problem. Running an Acquisition campaign into a Retention problem is the most expensive mistake in internal marketing: you onboard new users into the same experience that drove the last cohort away.
If active users exist but use fewer than 30% of available capability, your lever is Stimulation. The product is adopted but not activated. More features will not solve this. Deeper engagement design will.
Phase B — Write the SMART Adoption Goal
You should translate your ambition into a specific, measurable, time-bound target. "Improve adoption" is not a goal. A goal reads as follows:
| Lever | Internal SMART Goal Example |
|---|---|
| Acquisition | Achieve ≥ 70% of [Finance dept.] completing at least one full workflow in the tool within 90 days of go-live |
| Retention | Reduce reversion to legacy tools from 40% to ≤ 10% within 6 months among current users |
| Stimulation | Increase average weekly active sessions per user from 1.2 to ≥ 4 within the [Sales Ops] team by Q3 |
Replace the bracketed department names with your Lead Segment. Replace the metrics with the specific data you can track. The goal must be specific enough that at the end of the period you can answer yes or no without interpretation.
Phase C — Unlock the Strategic Archetype
The same 9 archetypes that apply to external marketing apply to internal products. Before you run the combination lookup, read this table. It gives each archetype a plain-language internal context so you recognise your situation before you confirm the inputs.
| Archetype | Internal Marketing Context |
|---|---|
| A1 Disruptive Newcomer | New tool entering the organisation with established incumbents still in active use — must demonstrate functional superiority fast or users will not switch |
| A2 Efficiency Machine | Commodity utility tool — win on frictionless adoption and ease of use, not differentiation; every extra step in onboarding costs you adoption |
| A3 Brand Evangelist | Culture-first programmes — wellbeing, D&I, values — where belonging and identity drive adoption more than features or efficiency |
| A4 Stagnant Leader | Existing tool losing ground to shadow IT and workarounds — fix churn back to legacy methods before pushing any new usage or capability |
| A5 Pivot Pioneer | Product that has lost the adoption battle — a new release will not reverse this; fundamental redesign or repositioning is required before the next rollout |
| A7 Scale-Up Guardian | Successful pilot now scaling organisation-wide — protect the experience quality that drove pilot adoption before it degrades at volume |
| A8 Niche Expert | Specialised tool for one department or function — build deep expertise and capability for that segment; do not attempt universal rollout before the niche is solid |
| A9 Category Creator | First-of-its-kind internal capability — employees have no pre-existing mental category for what it does; you must define the JTBD before you drive adoption |
A9 is the most common archetype in internal digital transformation. When you are introducing an AI copilot, a data platform, or an integrated strategy tool, your users have no pre-existing mental category for what the product does. They do not know what job it does for them. You have to create that category before you drive adoption. That means JTBD (110), Positioning (220), and Storytelling (520) are your Fatal Brakes — and you should fix all three before you plan any rollout activity, any training session, or any communication campaign. A user who cannot answer "what does this product do for me in one sentence" will not adopt it regardless of how many announcements you send.
Your archetype is determined by the combination of M3 × M4 × Revenue Lever. This is deterministic. Same inputs, same archetype, every time.
| M3 | M4 | Lever | Archetype | What it means internally |
|---|---|---|---|---|
| Intro | Services / Experience |
Acquisition | A9 Category Creator | First-of-its-kind internal capability — users have no mental model for what it does. Define the JTBD (110) before anything else. |
| Growth | Products | Acquisition | A1 Disruptive Newcomer | Competing against an established legacy tool — must demonstrate functional superiority fast. |
| Growth | Experience | Retention | A7 Scale-Up Guardian | Successful pilot now scaling — protect the experience quality that drove pilot adoption. |
| Maturity | Services | Retention | A4 Stagnant Leader | Established tool losing ground to workarounds — fix the retention brake before any new feature or campaign. |
| Maturity | Commodity | Acquisition | A2 Efficiency Machine | Compliance or process tool — win on frictionless adoption, not differentiation. |
| Maturity | Products | Retention / Stimulation |
A8 Niche Expert | Specialised departmental tool — build deep capability for one segment, do not attempt universal rollout. |
| Decline | Any | Any | A5 Pivot Pioneer | The tool has lost the adoption battle. A new release will not save it. Fundamental redesign or pivot required. |
You should look up your combination and confirm the archetype. If the result feels uncomfortable — if it tells you that you are a Stagnant Leader when you expected to be a Scale-Up Guardian — go back to M3 and M4. One of the inputs is wrong. Do not adjust the inputs to produce a more comfortable archetype. The method's value is in accepting the diagnosis, not in managing it.
Step 3 — Score 10 Dimensions. Not 24.
Once your archetype is confirmed, you score exactly 10 dimensions: the Vital 8 — 2 Fatal Brakes, 2 Primary Accelerators, 2 Secondary Brakes, 2 Secondary Accelerators — plus 2 Growth Drivers.
You should not score all 24 dimensions. The archetype has already done the filtering. The 14 remaining dimensions are not irrelevant — they are simply not decisive for your archetype and your goal in this cycle. Scoring them dilutes your focus and spreads your initiatives across dimensions that will not move your adoption metric.
The Vital 8 configuration for your archetype is available at marketingcanvas.net. Look it up before you score.
The scoring instruction that changes everything: score every dimension from the perspective of your Lead Segment user on a typical working day — not from your perspective as the person who built or manages the product. If the user cannot find the feature, Features (310) scores negative. If the user does not understand what job the product does for them, JTBD (110) scores negative. If the user would choose their workaround over your product this morning, score the relevant experience dimension negative.
The MCM scoring scale runs from −3 to +3 with no zero. Every dimension is either helping your adoption goal or hurting it. There is no neutral.
Two patterns you will encounter in almost every internal product assessment:
If your archetype is A9 Category Creator — M3 Introduction + M4 Services or Experience — your Fatal Brakes are JTBD (110) and Positioning (220). Users have no mental model for what your product does. No feature release, no training session, and no communication campaign fixes a −2 score on JTBD (110). You should define the job in one sentence that a user would use themselves before you plan any rollout activity. You should also not score Channels (430) or Media (530) — they are not in the A9 Vital 8 and they are not what is blocking adoption.
If your archetype is A4 Stagnant Leader — M3 Maturity + Retention lever — your Fatal Brakes are Experience (420) and the dimension equivalent to churn rate. The product is losing to workarounds. You should fix what is driving users away before you add any new capability. Every new feature you release before fixing Experience (420) is a new feature that users will ignore as efficiently as they have ignored the existing ones. Features (310) is not in the A4 Vital 8. You should not score it or generate initiatives around it in this cycle.
In both archetypes, you will almost certainly score Listening (510) negatively. The support tickets and corridor conversations you have been treating as a feedback loop are not systematic Listening. Systematic Listening means a structured process that regularly converts user signals into scored inputs that change your priorities. If you do not have that process, score Listening (510) at −1 or lower.
Steps 4 and 5 — FIX Before You Scale
Your gap analysis from Step 3 feeds directly into 15 initiatives across three streams: FIX, ALIGN, and SCALE. These are not simultaneous. They are sequential, gate-locked cycles of four months each.
You should run FIX before you run any campaign, announcement, or cross-department rollout.
The FIX cycle addresses your Fatal Brakes only. Typical FIX initiatives for internal products: rewriting the product's internal landing page around a one-sentence JTBD statement, running a 90-minute UX friction audit with three Lead Segment users, removing the mandatory IT approval step that was adding two weeks to onboarding, integrating with the one system your Lead Segment has open every morning.
None of these are feature releases. Most require one sprint from your UX or content team, not your engineering team. You should allocate 80% of your adoption investment to FIX in the first four months.
The ALIGN cycle activates your Primary Accelerators — usually Experience (420) and Storytelling (520) for internal tools. This is where peer champion programmes, redesigned onboarding, and documented success stories from your Lead Segment belong. You should not start ALIGN until your Fatal Brakes have cleared their targets.
The SCALE cycle is cross-segment expansion. You roll out to secondary departments here — not before. You should not announce the product to the whole organisation until your Lead Segment adoption target is confirmed. If you scale before the experience works, you spend your one announcement telling 800 people that the product has problems. You do not get a second announcement.
The gate between each cycle is a measurable condition, not a calendar date. The Integrity Gate between FIX and ALIGN: Fatal Brakes both score ≥ +1. The Relevance Gate between ALIGN and SCALE: Primary Accelerators both score ≥ +2 and your Lead Segment adoption SMART goal is confirmed.
The Single Most Important Decision
Every internal product launch that failed despite sufficient budget and executive sponsorship had one thing in common: the team skipped Steps 0 through 3 and went directly to Step 4.
They had a list of initiatives — training sessions, launch events, mandatory adoption deadlines — before they had diagnosed the problem. They ran campaigns without knowing the JTBD. They scaled without confirming the experience. They generated initiatives for dimensions that were not in their archetype's Vital 8.
You should run the diagnostic sequence before you commit any resources to initiatives. Steps 0 through 2 take three hours with a small working group. That three hours will produce more strategic clarity than your last six months of launch activity.
If you want to see how your current internal product scores on the 10 dimensions that matter for your archetype, start with the quick assessment. It will tell you your current position on the MCM scale, identify your Fatal Brakes, and give you the starting point for your FIX cycle.
[Start the Marketing Canvas Quick Assessment → laurentbouty.com/quick-assessment]