Marketing strategy that works
in the real world.
Framework deep-dives, archetype guides, and research analysis built on the 24 dimensions of the Marketing Canvas Method.
Don't know your archetype yet?
12 minutes. 24 dimensions scored on a forced-choice scale. You get your Strategic Archetype, your Vital 8 against target, and your Fatal Brakes flagged — before you read anything else.
Get the scoring worksheets.
6 printable A4 scoring grids for running the MCM assessment with your team — no screen required.
No sales emails. GDPR-compliant. Unsubscribe any time.

AARRR tells you retention is falling. It cannot tell you why.
Dave McClure called it Startup Metrics for Pirates. Metrics, not strategy. The funnel tells you retention is falling; it has no way to tell you whether the cause is the job you are serving, the experience after the sale, or the price. Six causes, one red number, and a one-in-six chance your fix is the right one.

The Digital Marketing Canvas gets it right. The next step is scoring it.
Jeremy Corman's Digital Marketing Canvas gets the hard part right: the fundamentals feed the funnel. What it cannot do is tell you whether your fundamentals are load-bearing or decorative. You write a sentence in the Value Proposition box in thirty seconds, and then spend four quarters optimising downstream of a claim nobody ever tested.
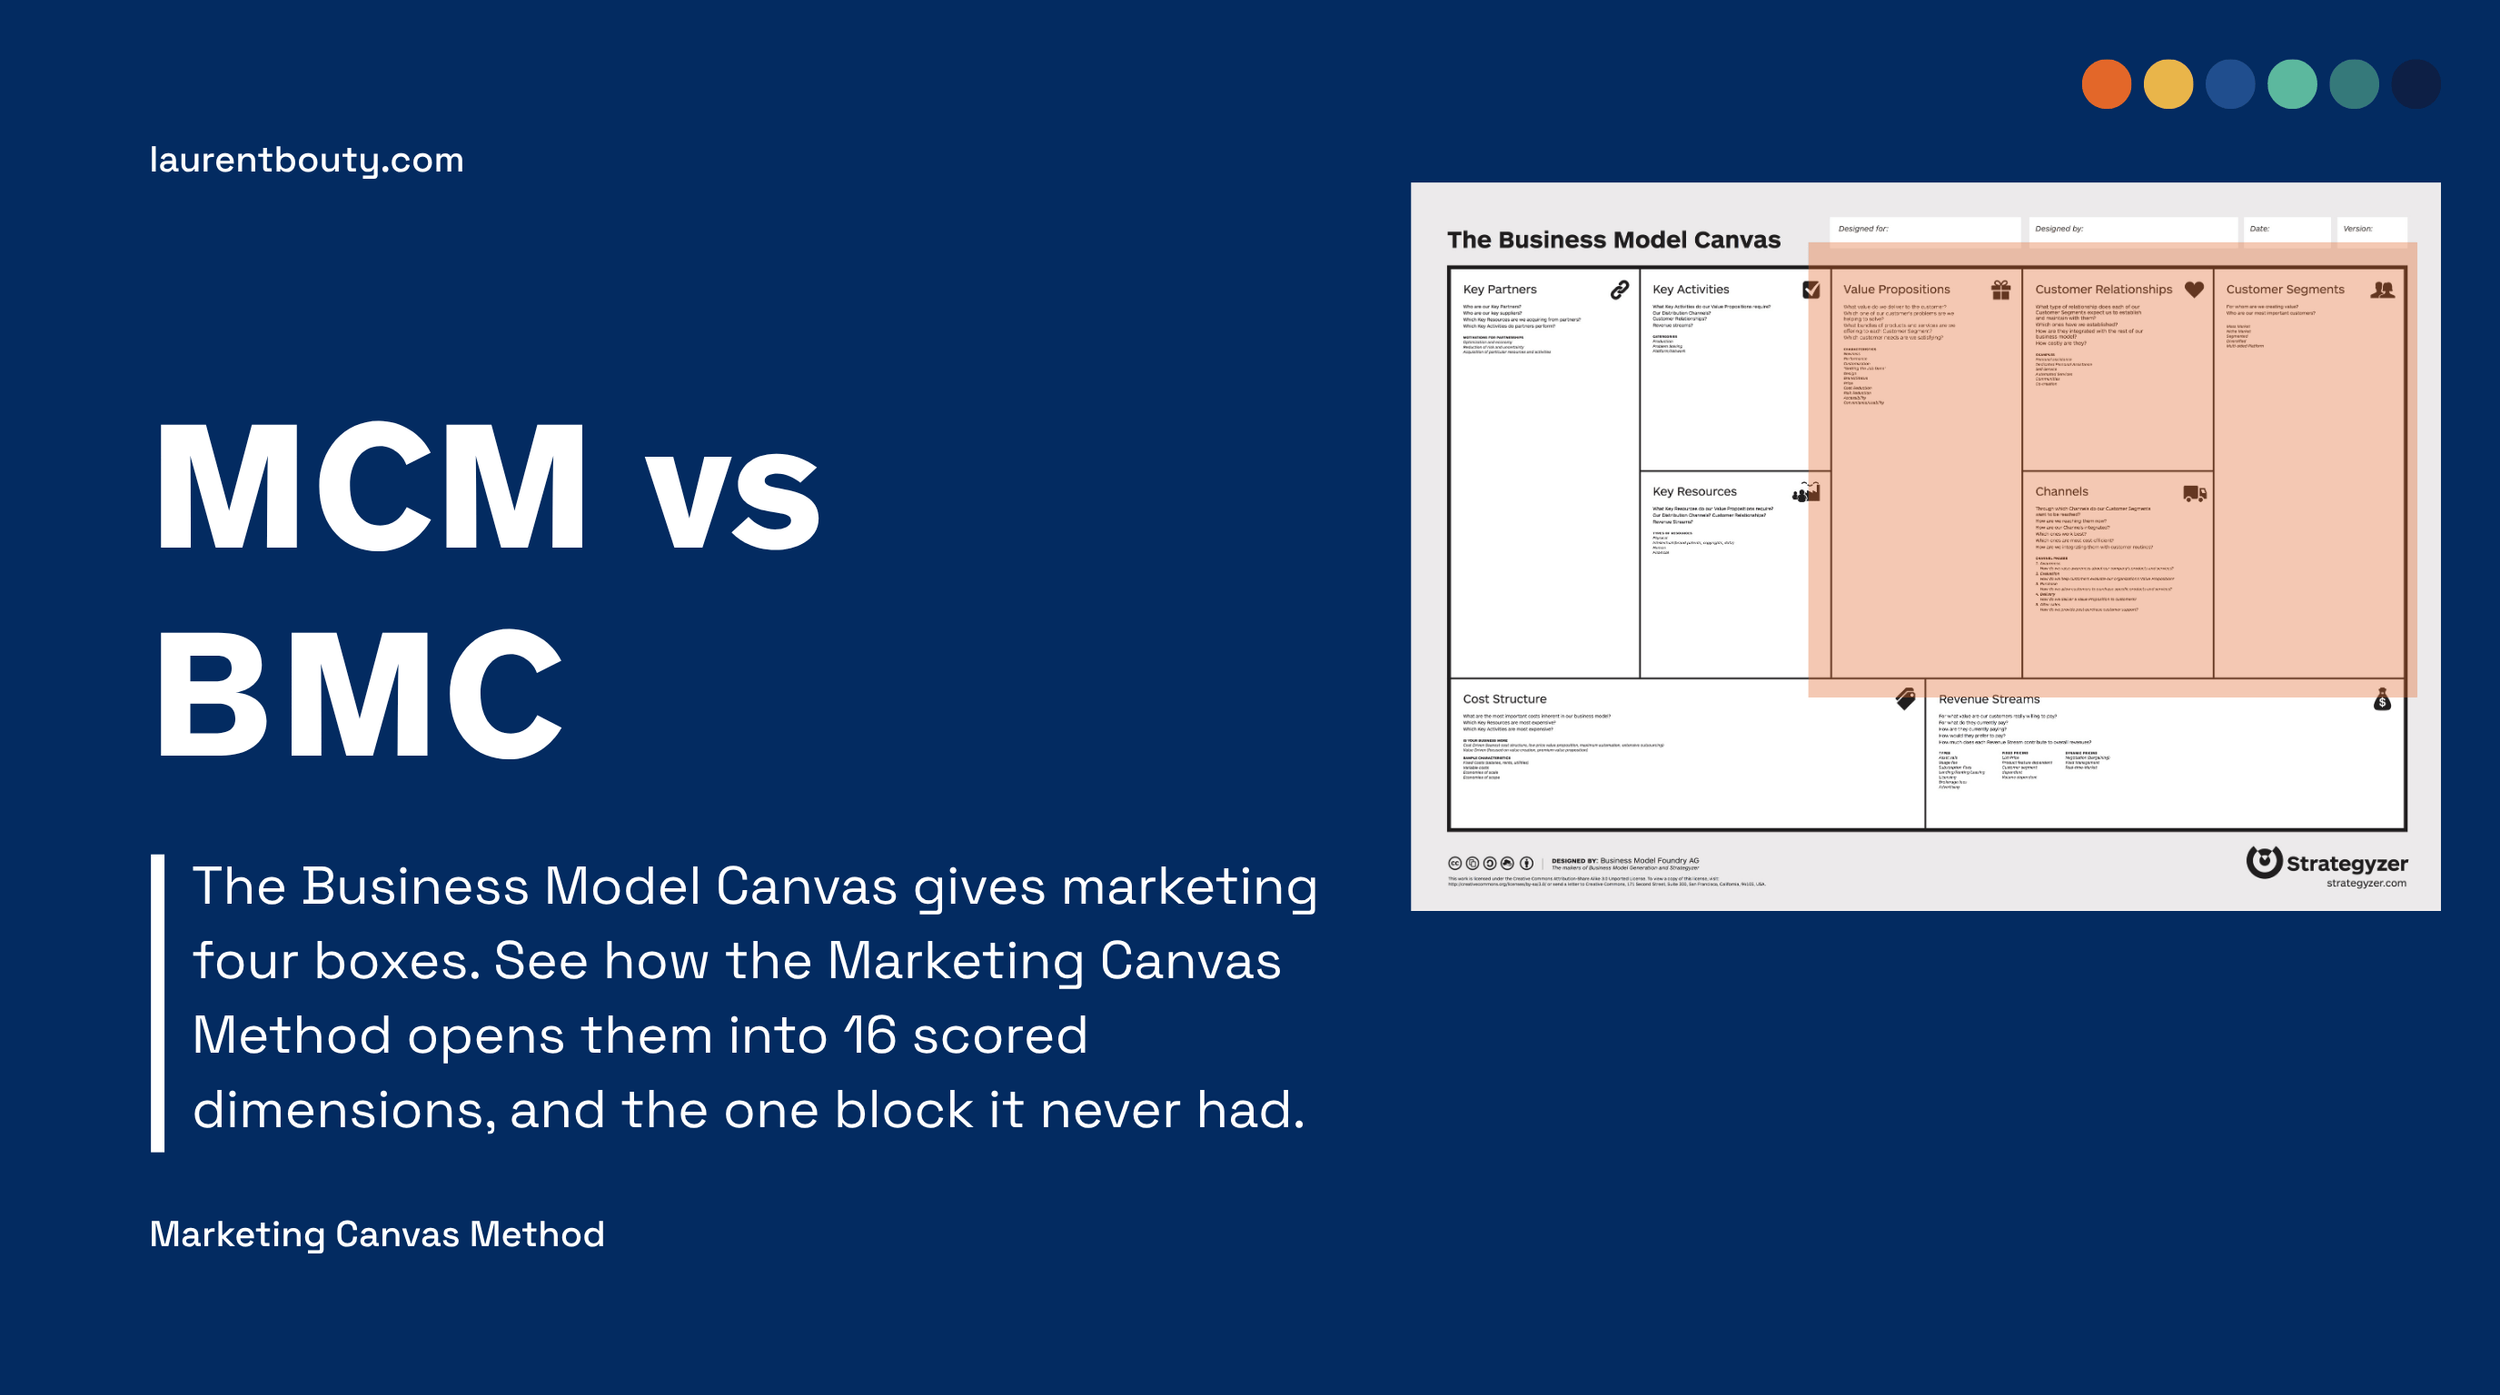
How the Marketing Canvas Method complements the Business Model Canvas
Osterwalder's canvas describes an entire business in nine boxes, and it does that better than anything else. Ask for the marketing strategy, though, and everyone points at the same two. Four of the nine are really marketing's, and a box is not a strategy. Where the BMC hands off, and what the Marketing Canvas Method does next.

You can pass six of the seven growth tests and still miss the number
McKinsey's seven-test checklist for B2B growth is sound, but a checklist run in parallel is not a strategy. It hides which item is sinking your number. The Marketing Canvas Method shows which test is actually yours, and what order to fix them in, with Nokia, Nespresso, and Sage as proof.

The Marketing Canvas Method vs the 4Ps of Marketing: why it is time to evolve
Product, Price, Place, Promotion. Sixty-five years on, the marketing mix still covers exactly half the canvas, and the half it misses is the customer, the brand, and whether any of it worked. Why "be more customer-centric" was the right answer in 1990 and still fixed nothing, and what a marketing mix alternative has to do instead.
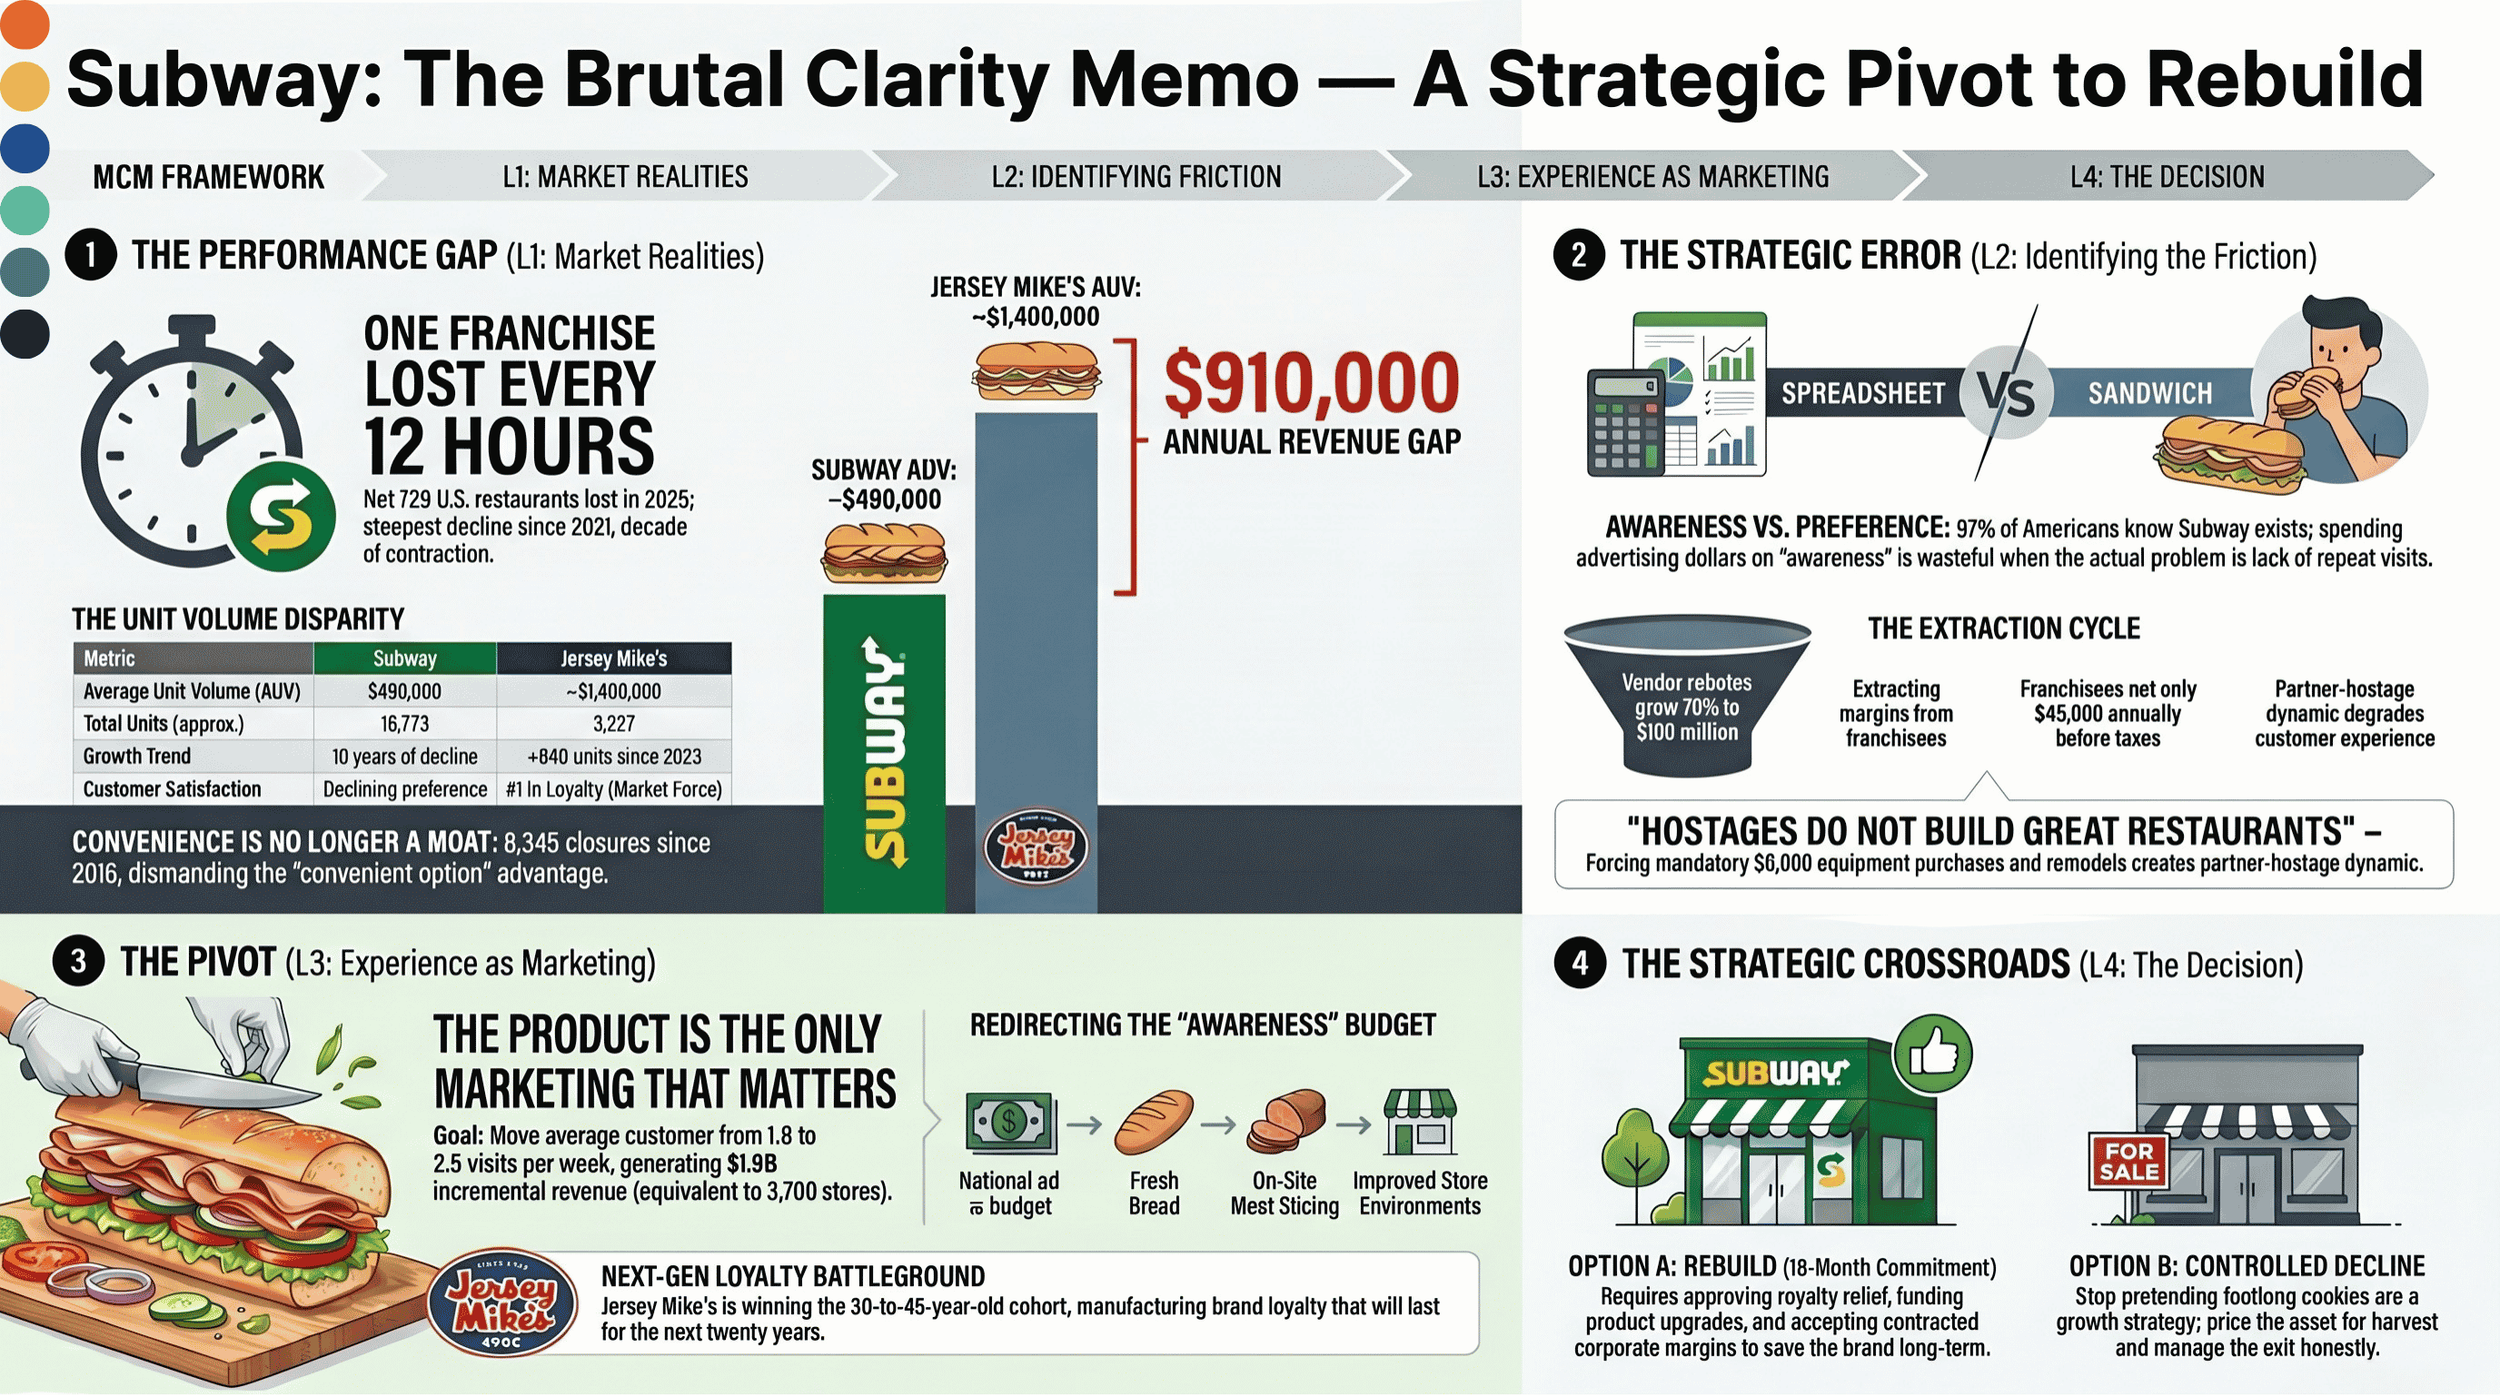
Subway Is Losing a Franchise Every Twelve Hours. Here Is the Memo That Says Why.
Subway is losing a franchise every twelve hours. Jersey Mike's makes three times the revenue per location with one-sixth the stores. The brand stands for nothing beyond cheap sandwiches. Roark Capital loaded $5.7 billion in debt onto a company that needs reinvestment, not extraction. None of this is hidden. So why does the Marketing Canvas Method memo land differently than a consultant's slide deck? Because the method constrains bad advice, makes every recommendation falsifiable, and fits the portfolio to what the organisation can actually execute. Here is how it works — and the memo itself.
Anthropic vs. the Three Competitive Axes
Most AI market commentary frames competition as a three-way race between Anthropic, OpenAI, and Google. The Marketing Canvas Method reveals a different picture: six players across four economic-value positions, running four different strategic archetypes, pressuring Anthropic along three axes simultaneously. The most consequential competitor is not who you think.
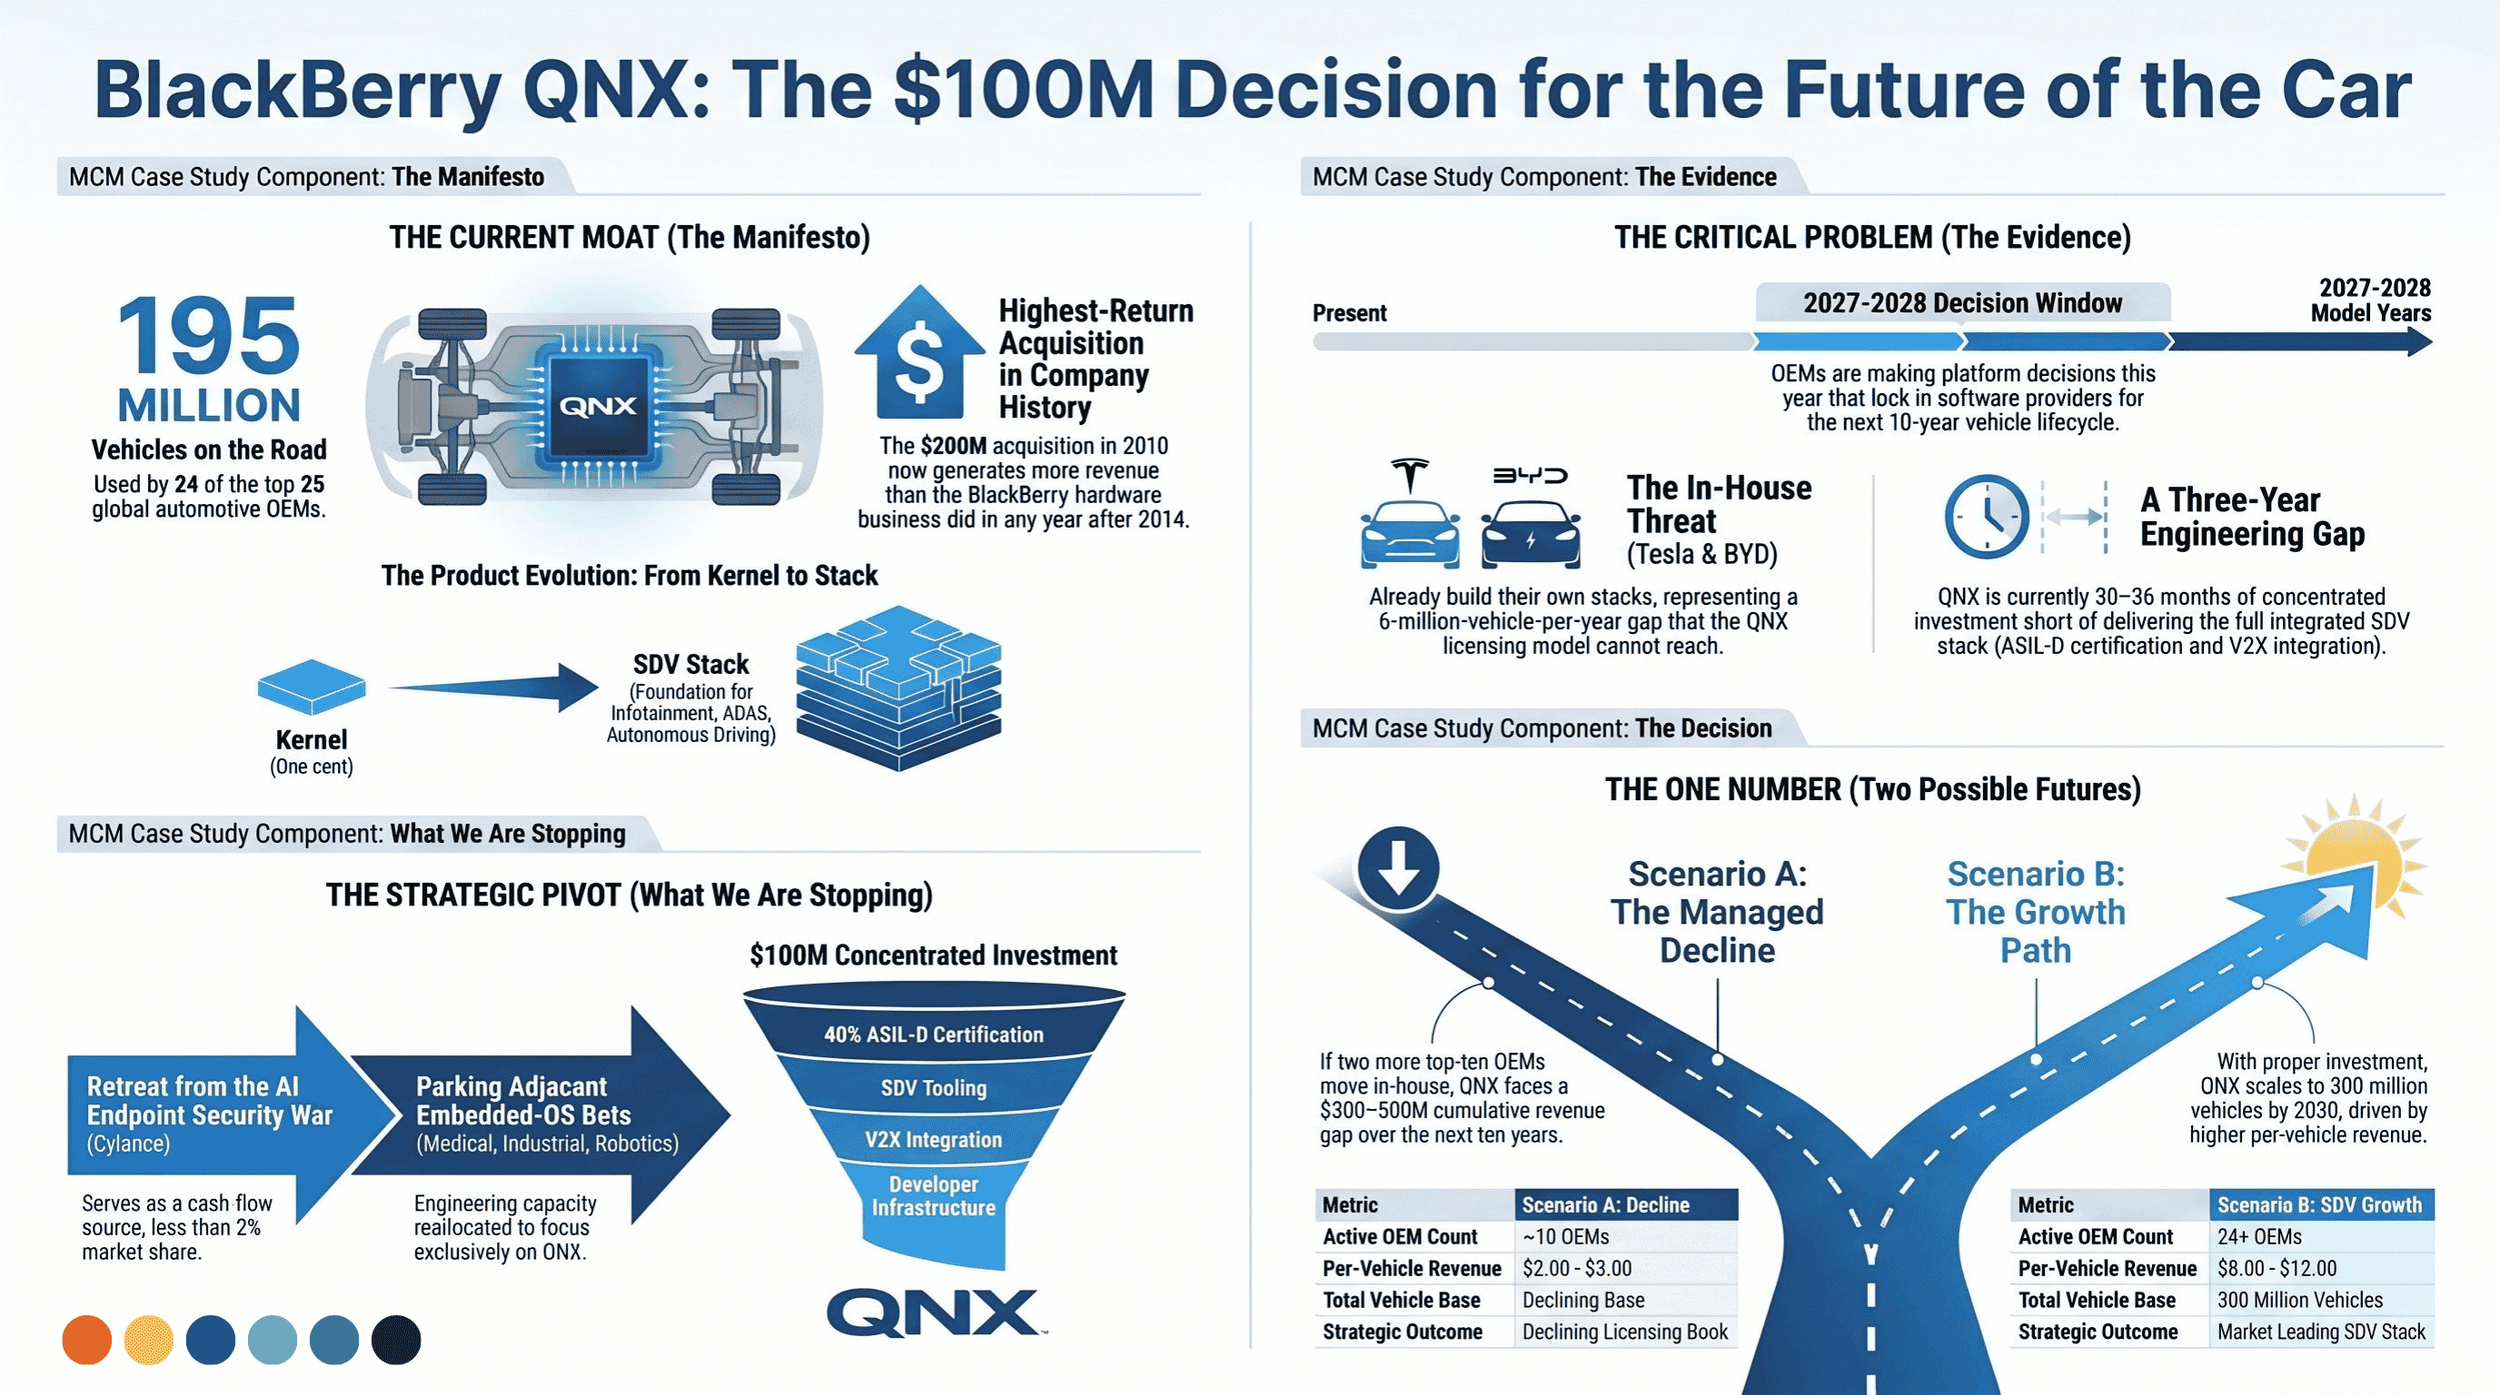
BlackBerry — A Brutal Clarity Memo on QNX
BlackBerry's QNX operating system runs in 195 million cars and is licensed by 24 of the top 25 automotive OEMs. Tesla and BYD chose to build their own. Three of the top ten OEMs are deciding right now whether to follow them. A two-page board memo on the $100M capital-allocation decision that cannot wait.
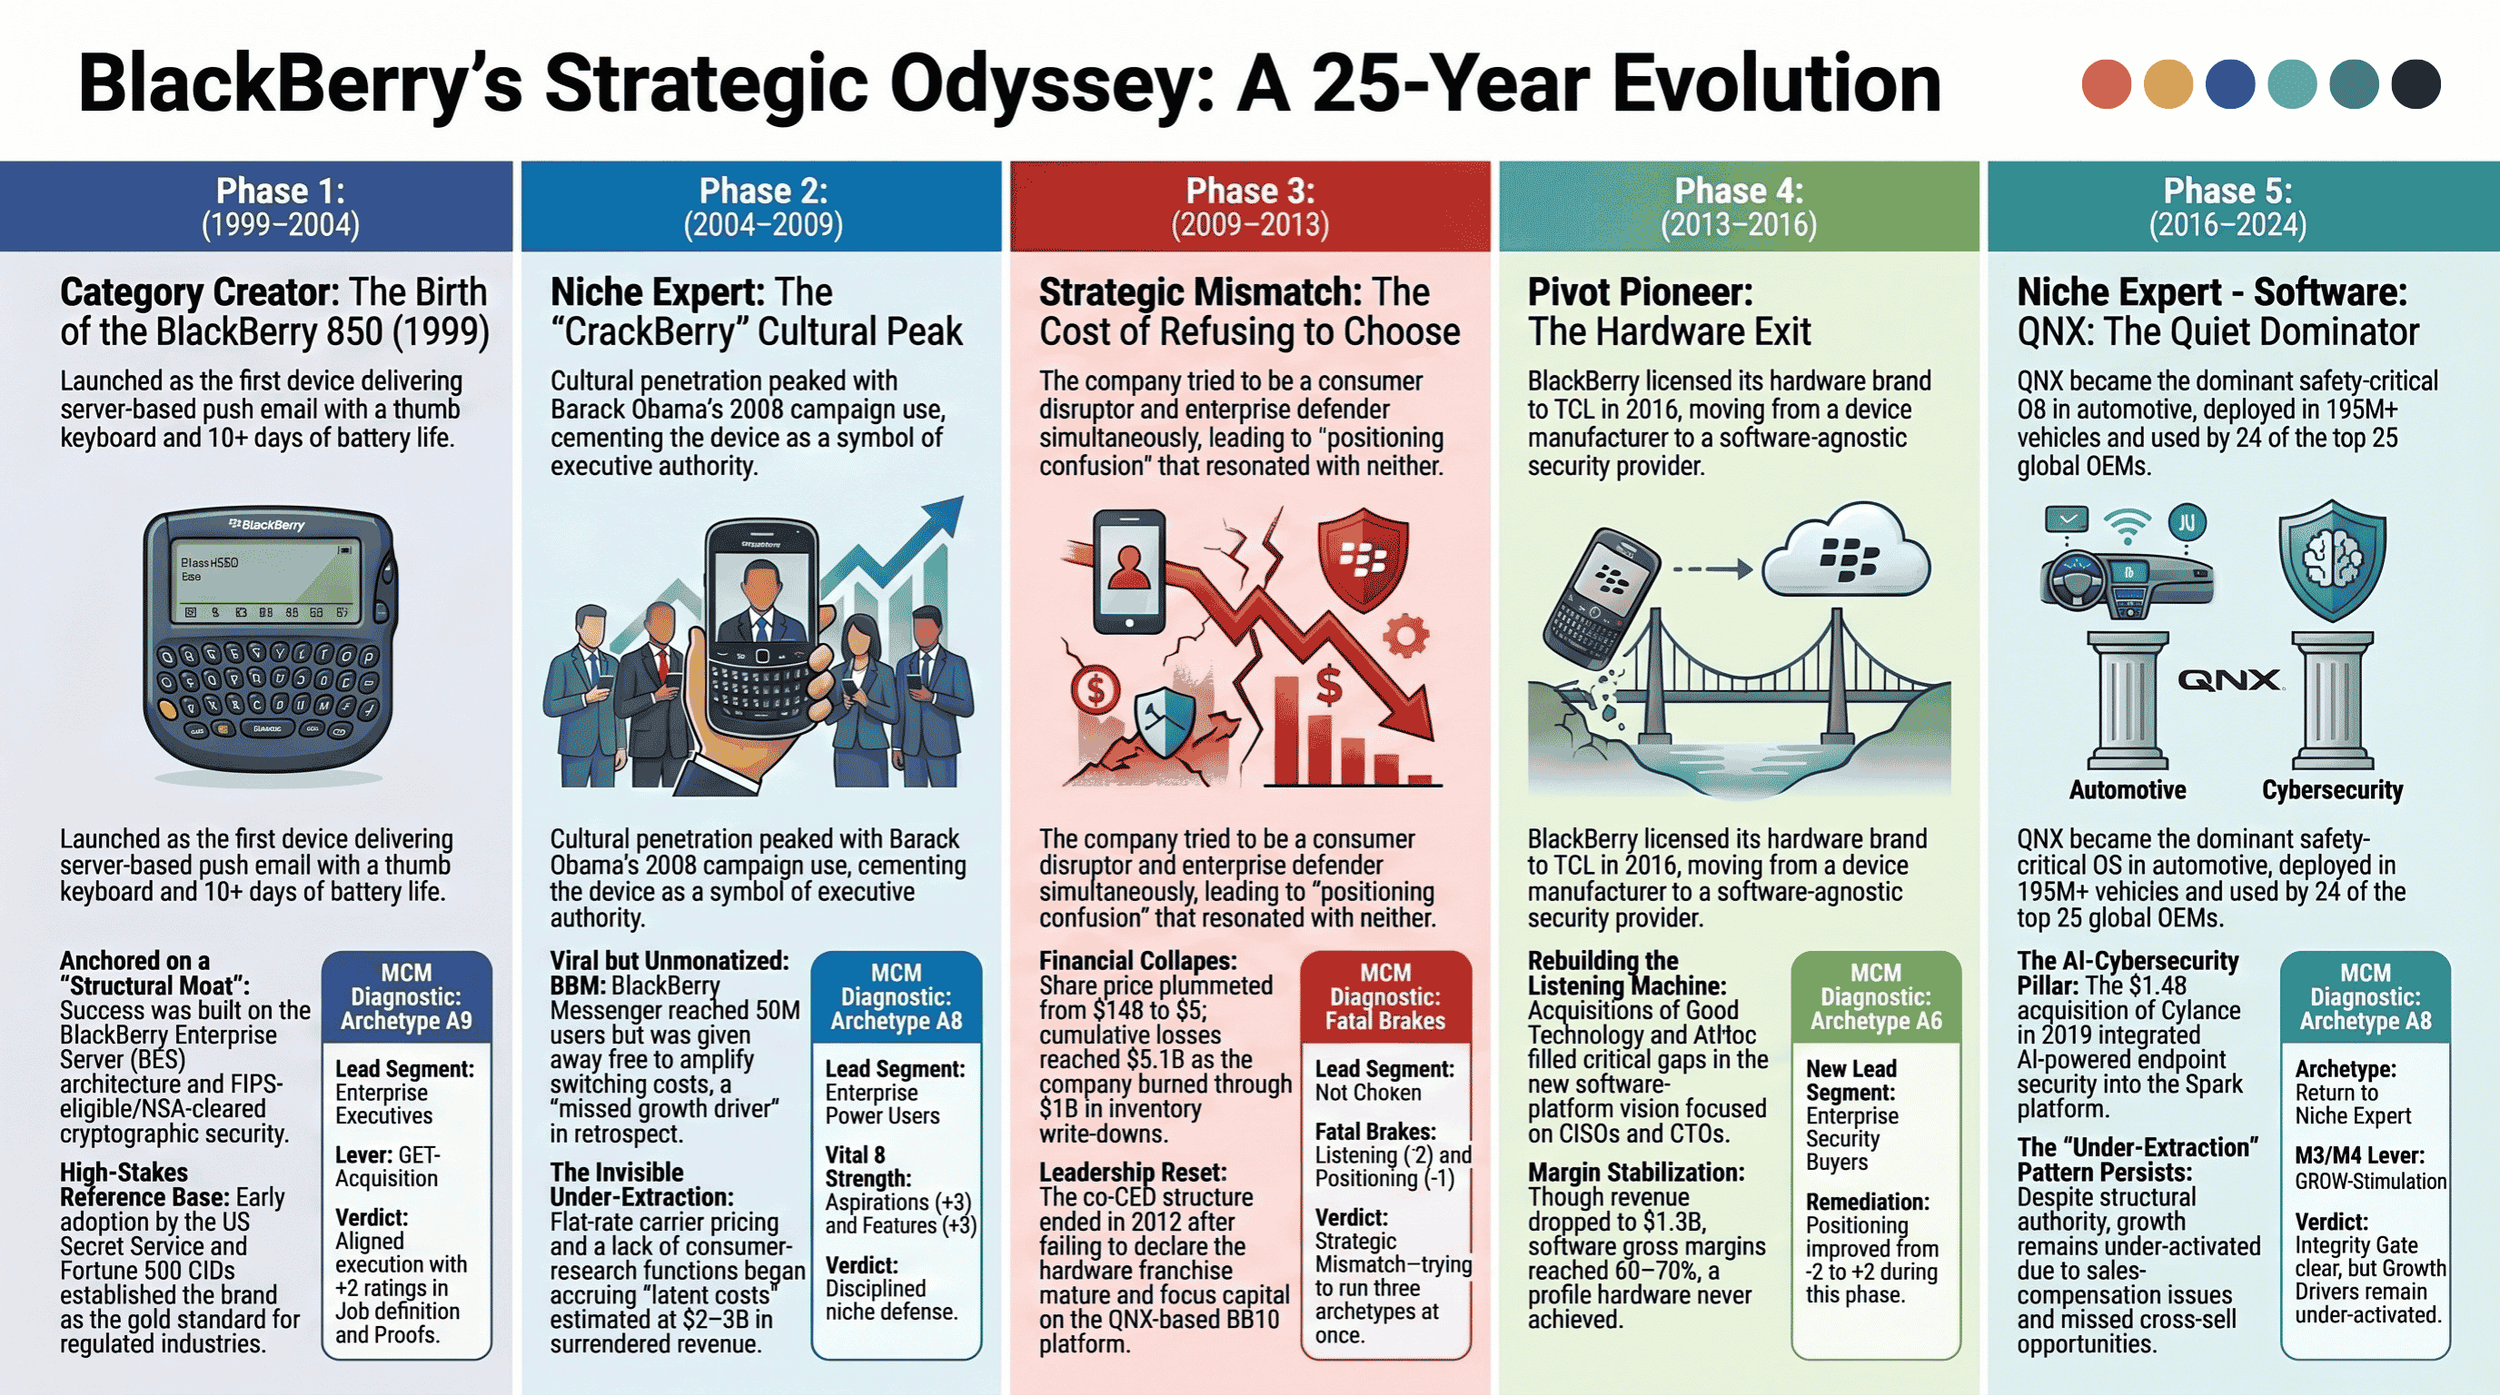
BlackBerry — A Strategic History Memo, 1999–2024
The complete v5.0 evidence base for BlackBerry's 25-year strategic evolution. Five archetype phases from 1999 to 2024 captured with Vital 8 scoring, Mechanism Maps, Operating Baseline reconstruction at three anchor moments, and falsifiable Step 4 anatomy. Q-tier sourcing throughout. For practitioners and auditors.
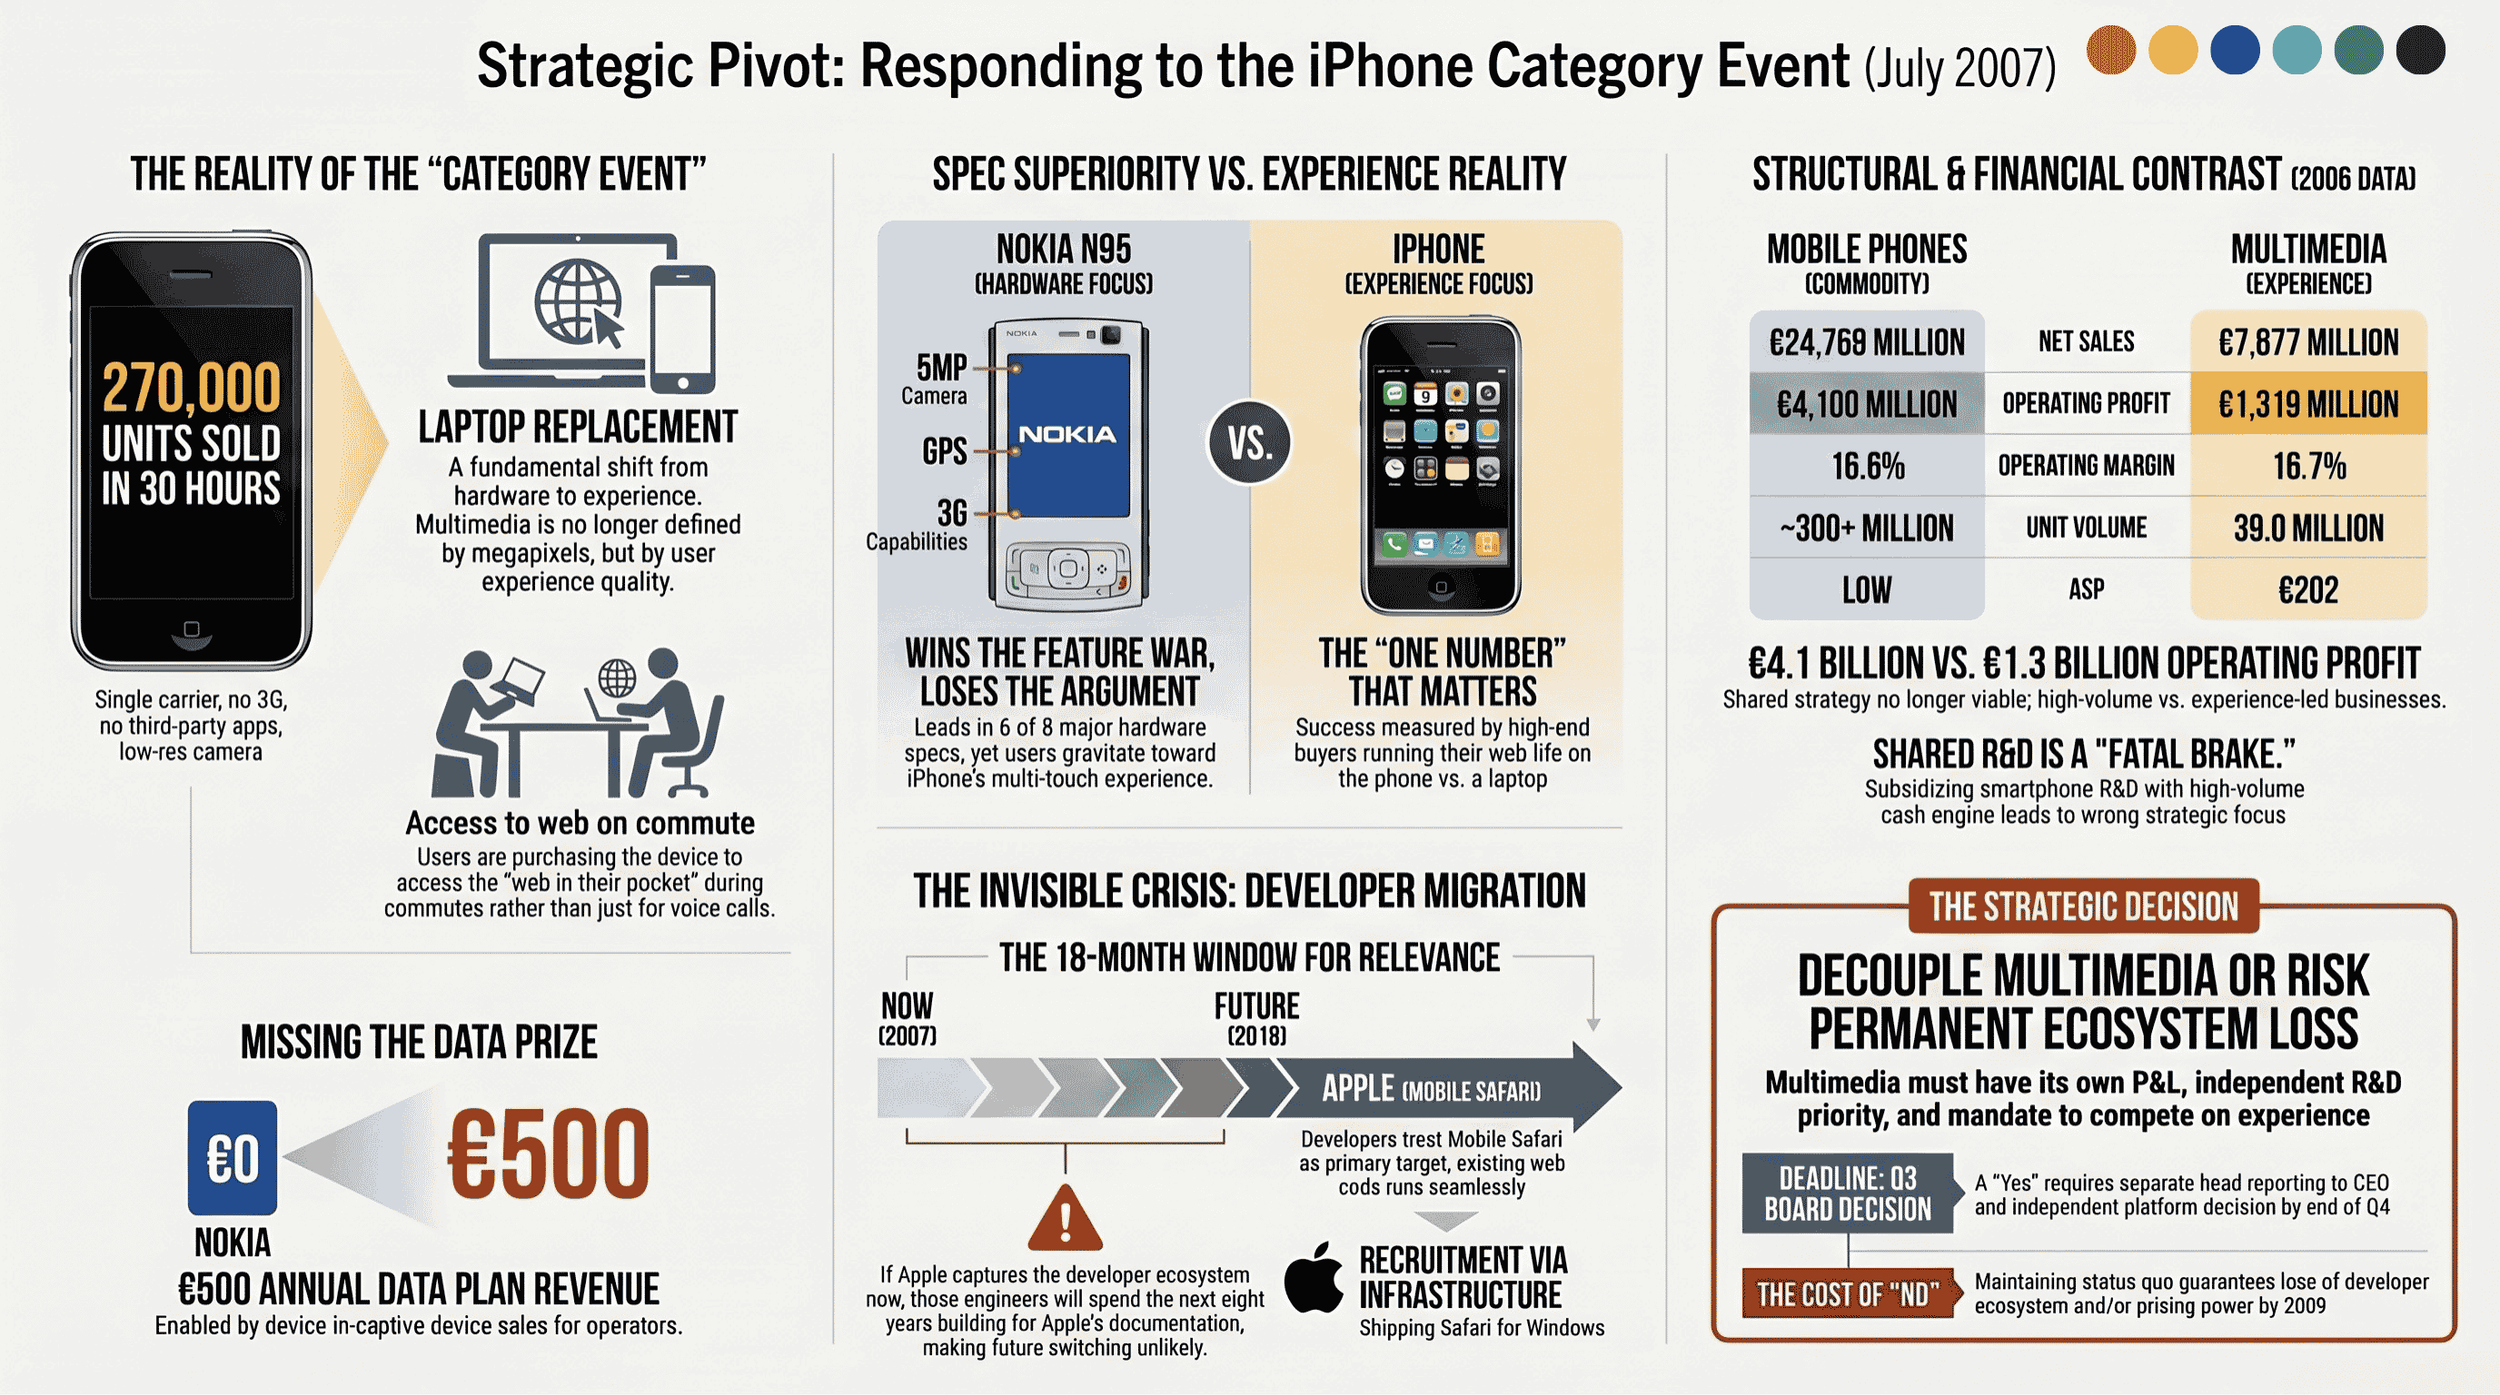
Nokia and the iPhone: The Memo Never Written, July 2007
What Nokia's CEO should have read on 30 July 2007 — one month after the iPhone launch. A Brutal Clarity Memo written using only data publicly available at the time. No hindsight permitted.
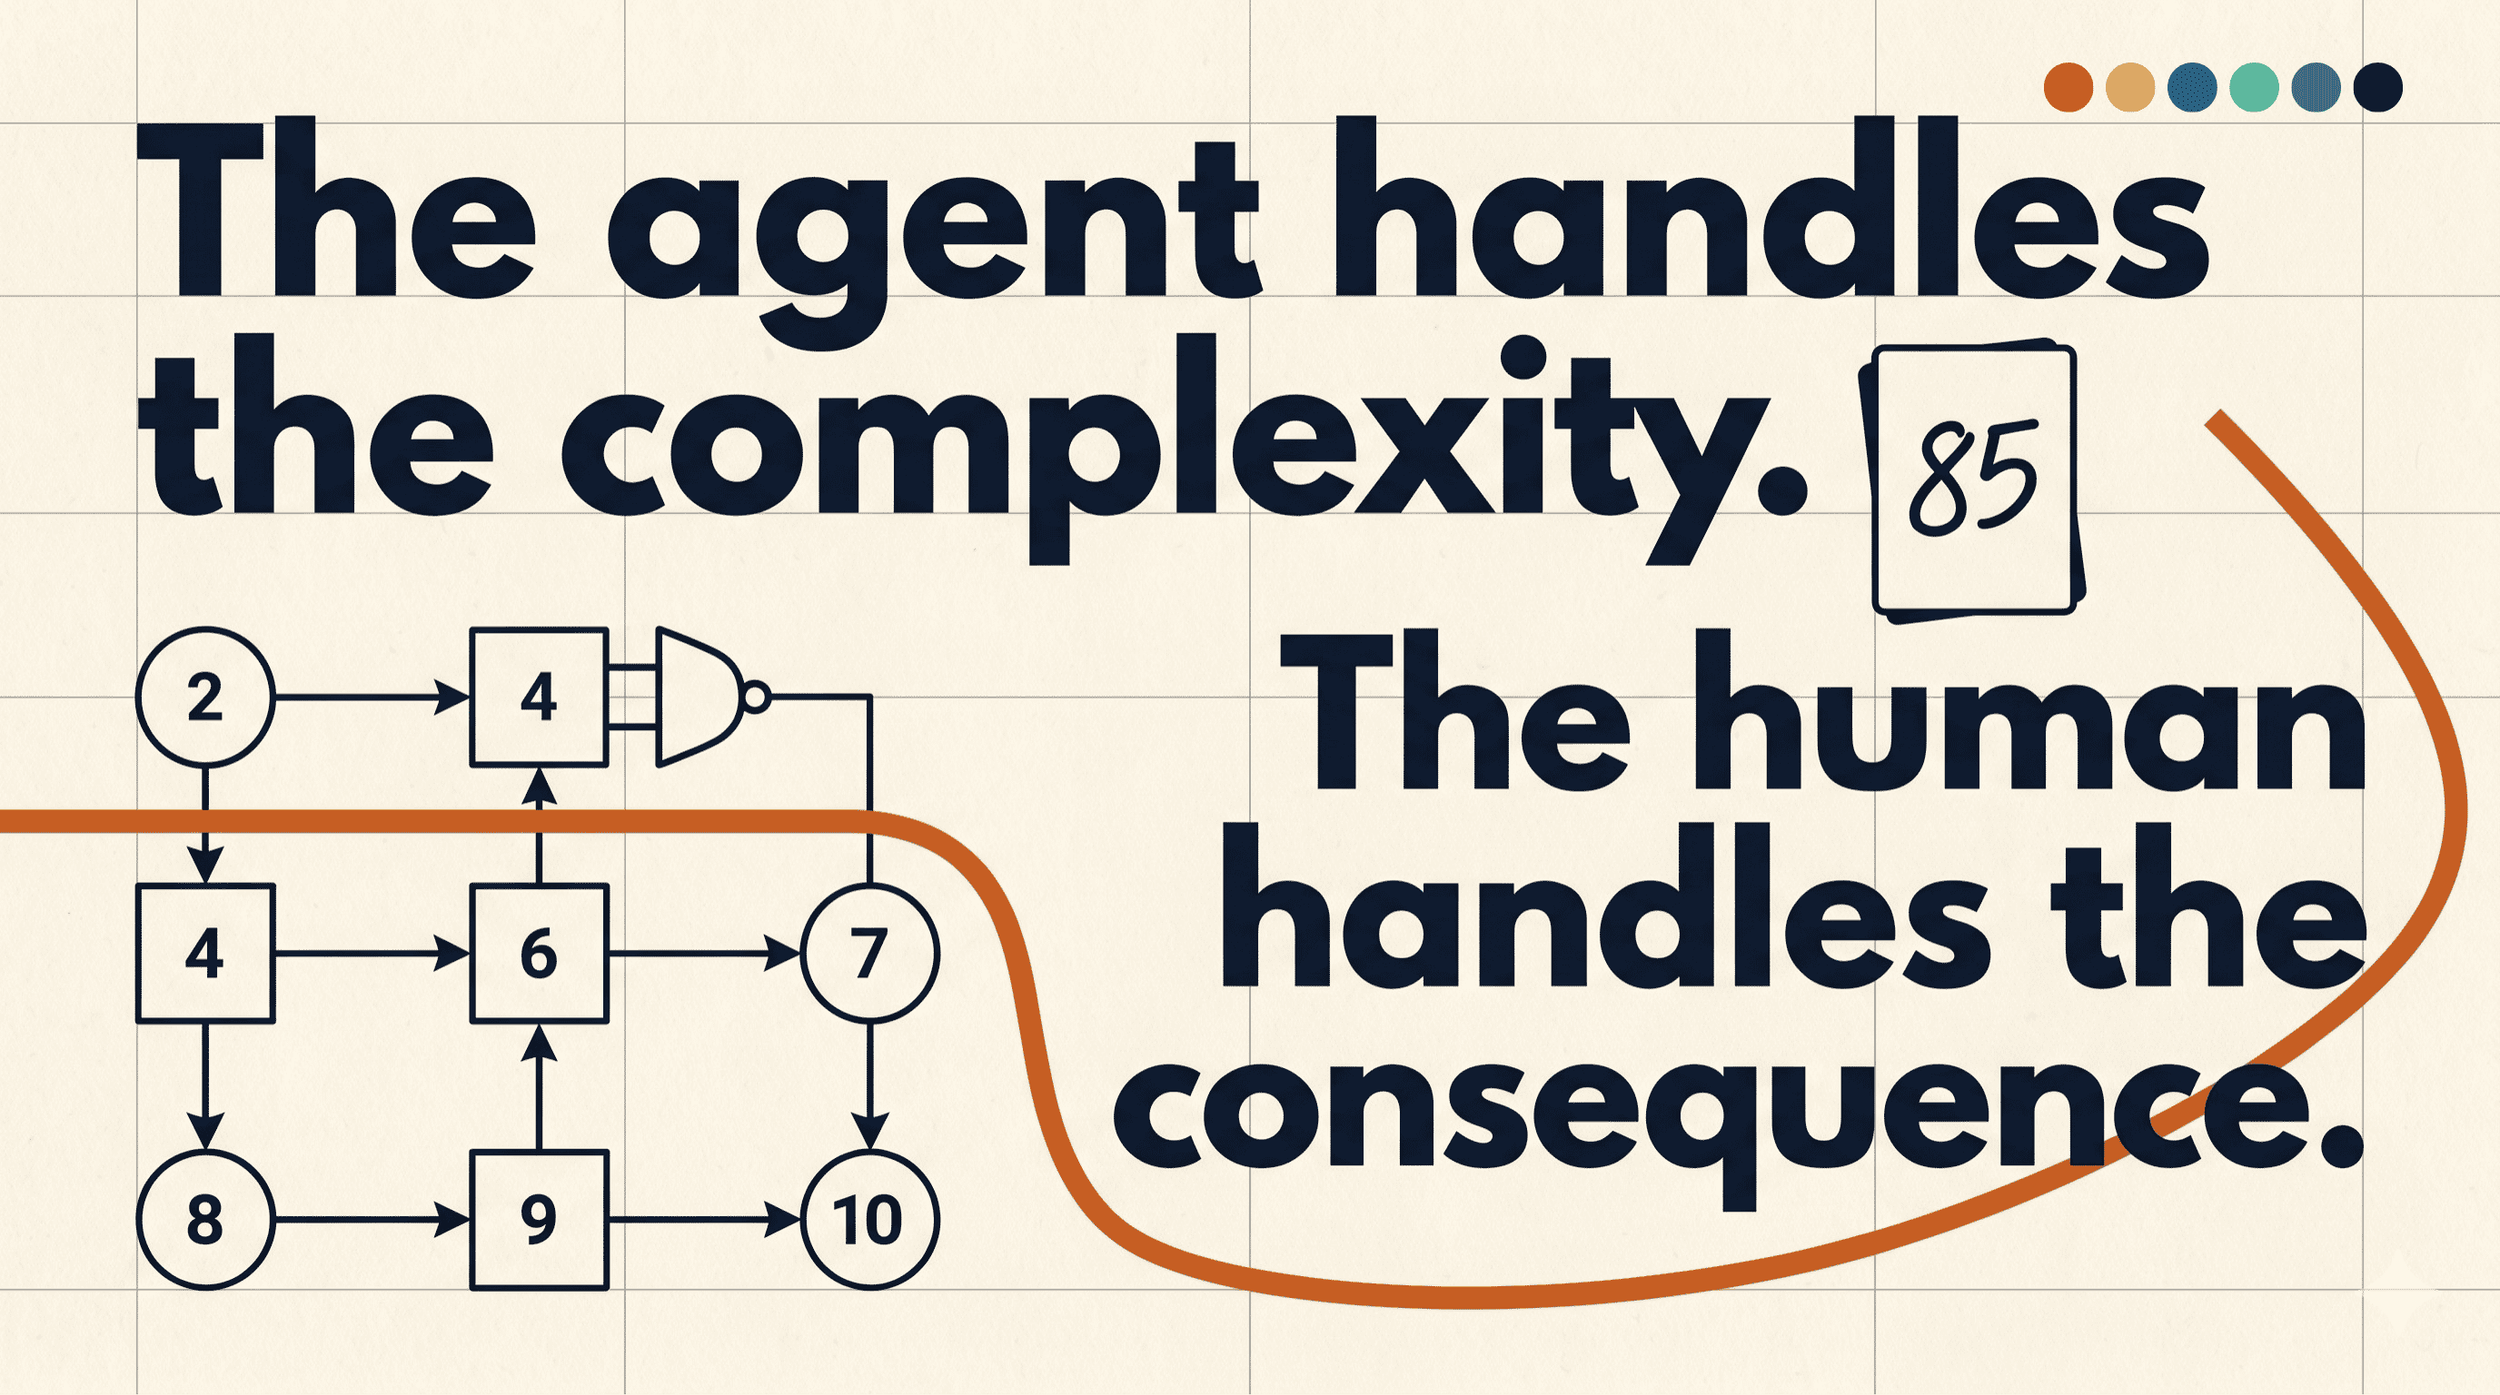
Marketing Strategy in an Agentic World
AI agents are now completing transactions on behalf of consumers — without visiting your website, reading your reviews, or seeing your ads. Your brand is being represented, recommended, or overlooked by systems you don't control. Most marketing frameworks weren't built for that. The Marketing Canvas Method was.

The Real Reason CMOs Don't Last
A recent HBR piece argues CMOs don't last because they can't speak the CFO's language. The prescription is sharp — and conditionally true. The same KPIs that save a McDonald's-style business break a Hermès-style one. Here's why archetype is the conversation that has to happen first.

Marketing Strategy Tools: Why a Toolbox Is Not a Strategy
You don't have a marketing strategy problem. You have a missing operating system. SWOT, BCG, Porter's and the other standard frameworks each illuminate something — but together they don't add up to a strategy, and in the AI era that gap is no longer survivable. Here's what does.
Apple Is Facing Two Different Problems. Almost Everyone Thinks It's One.
Apple just had the best year of its life. Four hundred and sixteen billion dollars in revenue. A hundred and twelve billion in profit. Every analyst on Wall Street is reading the same statement and reaching the same verdict — Apple is winning.They are reading the wrong number. The number that matters sits buried in the product section. In the most important holiday quarter of 2025, Apple Vision Pro shipped roughly forty-five thousand units. The consensus story is execution. The consensus story is wrong.

The MCM Greenwashing Integrity Check: Score with Evidence (7/7)
The MCM Integrity Check scores sustainability twice: once as claimed, once as evidenced. The gap between the two — in either direction — is the strategic risk to manage.

Purchase vs Participation: Two Modes of Sustainable Marketing (6/7)
Purchase-mode and participation-mode sustainability demand different strategies, scoring criteria, and evidence standards. Here is the MCM framework for both.
Compass Quadrant Strategy: From Diagnosis to FIX/ALIGN/SCALE (5/7)
Each Compass position implies a specific FIX/ALIGN/SCALE sequence and a four-stage maturity path. Here is the full strategic framework by quadrant.

The MCM Sustainability Score: 19 Questions, One Diagnostic (4/7)
19 questions across five meta-dimensions. Here is the full structure of the MCM Sustainability Score — and where the most common scoring errors occur.

How to Tell If a Brand Is Truly Sustainable or Just Claiming (3/7)
There is a simple test for whether a company's sustainability marketing is genuine or cosmetic. It uses two scores — and most companies only track one.

The MCM Sustainability Compass: A Two-Axis Diagnostic Framework (3/7)
Commercial performance and sustainability are independent. The MCM Compass maps both — and shows why measuring only one misreads your position.