
BLOG
A collection of article and ideas that help Smart Marketers to become Smarter

Mastering Market Definition and Key Benefits for Competitive Positioning
Defining your market and identifying the key benefits that matter to customers are foundational steps in building a competitive strategy. Knowing where your product or service fits ensures clarity about your audience and competitors, while understanding customer benefits—both functional and emotional—reveals opportunities for differentiation.
Where do you play, and what is your market situation? (focusing on M1 and M2)
Understanding your market is a critical first step in defining your business strategy. It involves answering two key questions:
What is your market? (Market Definition - M1)
What benefits matter most in your market? (Key Expected Benefits - M2)
This article explores these questions in detail and provides actionable insights to help you identify and leverage competitive positioning options.
What is your market? (market definition - M1)
Defining your market means understanding the boundaries of where you operate, who your customers are, and the nature of the competition. This is not just about naming an industry—it’s about identifying a specific space where your product or service plays a role.
Key Considerations:
Who are your target customers? Define their demographics, behaviors, and preferences.
What needs do you fulfill? Clearly articulate the problem your product or service solves.
What is the scope of your market? Determine the geographical and category boundaries that frame your competition.
Example: Eco-Friendly Cleaning Products If you’re in the eco-friendly cleaning products market, your target customers might be environmentally conscious homeowners. The need you fulfill is effective, sustainable home cleaning. Your market scope might include regional markets with high environmental awareness and disposable income.
Example: Tesla Model S Consider the Tesla Model S. It belongs to the broad market of cars, but we can further narrow this down into sub-markets. A common mistake is to categorize the Tesla Model S under the market of electric cars. However, being electric is a feature, not a market. Although both a Toyota Prius and a Tesla Model S are electric cars (one being a hybrid), they do not belong to the same market. The Tesla Model S fits into the Luxury E automobile or Executive/Mid-size luxury market, which also includes vehicles like the Porsche Taycan or the BMW 5 series.

Watch More: Tesla Market Positioning
As we delve deeper, we'll discover that once we have identified the market where our value proposition will compete, it's crucial to understand and follow a set of rules to shape our commercial strategy. After identifying your company's competitive market, we need to delve into the specifics. Just like a painter cannot create art without understanding their canvas, a marketer cannot formulate a strategy without understanding their market.
What benefits matter most in your market? (key expected benefits - M2)
Every market revolves around a set of benefits that customers prioritize. These benefits can be divided into two categories:
Functional Benefits: Practical and measurable advantages your product or service provides.
Emotional Benefits: Intangible, psychological rewards customers experience.
These benefits form the basis for competitive positioning, as each player in the market may emphasize different combinations of these elements.
Example: Eco-Friendly Cleaning Products Market
Effectiveness (Functional): Products that clean thoroughly without compromising on eco-friendliness.
Health and Safety (Functional): Non-toxic ingredients that are safe for families and pets.
Convenience (Functional): Easy-to-use packaging and availability in local stores or online.
Environmental Impact (Emotional): Customers feel good about reducing their carbon footprint and supporting sustainability.
Brand Trust (Emotional): A sense of confidence in the brand’s authenticity and values.
Example: Tesla Model S
Performance (Functional): Exceptional acceleration and range compared to competitors.
Innovation (Functional): Cutting-edge technology, including autonomous driving capabilities.
Sustainability (Emotional): Pride in contributing to reducing carbon emissions.
Prestige (Emotional): Association with a high-status, forward-thinking brand.
Ownership Experience (Emotional): Access to a seamless, premium experience from purchase to service.
Each of these benefits represents an opportunity for differentiation. For example, Tesla emphasizes performance and innovation as key functional benefits while simultaneously building strong emotional connections through sustainability and prestige.
Final thoughts
Defining your market (M1) and understanding its key benefits (M2) are foundational steps in building a competitive strategy. These insights not only clarify your market position but also inform how you can differentiate your offering in a way that resonates with your audience.
Take the time to explore these two critical dimensions of your market. Doing so will set the stage for deeper strategic decisions and ultimately, greater success in your chosen space.

Who Are Your Competitors, and How Do You Compare?
Understanding your competitive landscape is key to positioning your product effectively. By analyzing perceived price and benefits, you can uncover strategic opportunities and differentiate your offering. Learn how Tesla and GreenClean navigate their markets with actionable insights into pricing and benefits. Explore the method and enhance your competitive edge!
Understanding your competitive landscape is essential for positioning your product or service effectively. By evaluating your competitors’ strengths and weaknesses, you gain insights into where your brand stands and how to differentiate yourself. This post explores how to analyze competitors in terms of pricing and benefits, providing examples from Tesla and GreenClean to illustrate the process.
Step 1: Identify your competitors (M6)
Competitors in any market typically fall into one of several categories based on their positioning and market strategy, particularly in how they align with key benefits identified in your market. Understanding these roles provides a framework for evaluating competitors effectively:
Leader: Excels across multiple key benefits, often setting industry standards. Leaders tend to dominate on aspects like performance, innovation, and brand trust.
Challenger: Focuses on select benefits to compete directly with leaders, often balancing affordability with strong perceived benefits.
Game Changer: Disrupts the market by emphasizing new or underserved benefits, redefining customer expectations (e.g., sustainability or traceability).
Follower: Mimics the offerings of leaders or challengers without significant differentiation, usually relying on competitive pricing.
Niche Player: Excels in one or two highly specific benefits, targeting a distinct audience or segment.
Begin by identifying your key competitors. For each, gather the following information:
Price per unit (M7): The actual cost of their product or service. Identify their market role (e.g., leader, challenger, game changer).
Perceived price (M8): How customers perceive their pricing relative to competitors.
Perceived benefits (M9): How well competitors perform across key benefits that matter to customers.
Comments (M10): Observations on competitors’ positioning, strengths, or weaknesses.
This forms the foundation for understanding how your offering compares.
Step 2: Analyze perceived price (M8)
Price isn’t just about numbers; it’s about perceived value. Customers may pay a premium for products they see as more valuable. Use the following formula to calculate perceived price:
Formula for perceived price (M8):
M8=24(E−C)×(M7−C)−12
E: Maximum price per unit in the market.
C: Lowest price per unit in the market.
M7: Your product's price per unit.
This formula provides a score between -12 and +12, helping you understand how your pricing is perceived.
Example: Tesla model S (M7: Leader)
Maximum price (E): €120,000
Lowest price (C): €50,000
Tesla model S price (M7): €100,000
M8 = (24)/{120,000 - 50,000} x (100,000 - 50,000) - 12 = +4.8
Tesla’s perceived price is higher than average, reflecting its luxury positioning.
Example: GreenClean (M7: Challenger)
Maximum price (E): €15
Lowest price (C): €6
GreenClean price (M7): €10
M8 = (24)/{15 - 6} x (10 - 6) - 12 = -1.33
GreenClean’s perceived price is lower, appealing to price-sensitive customers.
Step 3: Evaluate perceived benefits (M9)
To calculate perceived benefits, assess competitors across key benefits (identified earlier in your analysis). For each benefit, score competitors on a scale of -3 (completely disagree) to +3 (completely agree).
Competitor comments (M10) should play a critical role in interpreting perceived benefits. For example, understanding why a competitor excels in specific areas can highlight strategic opportunities or challenges for your brand. Comments might also identify potential collaboration opportunities or gaps to address in your own offering.
Example : Tesla vs. competitors (M9)
Performance
Innovation
Sustainability
Customer Trust
Example Table: GreenClean vs. Competitors (M9)
Effectiveness
Convenience
Sustainability
Customer Trust
Step 4: Compare and interpret results
With perceived price and perceived benefits calculated, create a summary table to identify where you excel or need improvement.
Example : Tesla vs. competitors (M10)
Tesla: Leader in EV innovation, leveraging superior battery performance and software integration.
Porsche: Luxury competitor, lacks EV focus.
BMW: Established brand, but less innovative.
Example: GreenClean vs. Competitors (M10)
Greenclean: Challenger with a sustainability focus, offering affordable alternatives to premium eco brands.
EcoPure: Leader in premium eco-friendly solutions.
NatureFresh: Budget competitor, lacks differentiation.
Final thoughts
Understanding your competitors goes beyond pricing and benefits. This process helps identify gaps in the market, refine your positioning, and strengthen your value proposition. By analyzing perceived price and benefits, you can develop strategies that resonate with your target audience while staying ahead of competitors.
As seen with Tesla, a high perceived price can align with high perceived benefits to justify a premium position. Similarly, GreenClean shows how affordability and sustainability can differentiate a product in a price-sensitive market. Use these methods to assess your landscape and uncover opportunities to lead.
What strategies have worked for you in understanding competitors? Share your experiences and insights in the comments!

What are the trends influencing your market?
Understanding market trends is key to shaping your business strategy. By identifying trends as accelerators or brakes, you can align your goals with opportunities while mitigating risks. Learn how Tesla leverages trends like electric vehicle adoption and sustainability regulations to drive growth. Explore actionable methods to integrate trends into your strategic context and goal-setting.
This step focuses on identifying and evaluating the key trends shaping your market. By understanding these trends, you can determine their potential impact on your goals and define whether they act as accelerators or brakes.
Step 1: Identify five key trends
Trends can emerge from various domains, such as technology, society, the environment, economics, or politics. Begin by identifying the five most impactful trends relevant to your market.
Example categories of trends:
Technological Trends: Advancements in AI, automation, or digital transformation.
Social Trends: Changing consumer behaviors or demographic shifts.
Environmental Trends: Increasing focus on sustainability and green practices.
Economic Trends: Inflation, interest rates, or shifts in global trade.
Political/Regulatory Trends: New regulations or geopolitical events.
Step 2: Assess trend impact
For each trend, evaluate its influence on your market and goals. Trends can either:
Accelerate Ambitions (Accelerators): Trends that create opportunities and align with your goals.
Block Ambitions (Brakes): Trends that present challenges or barriers to achieving your objectives.
Example table: trends and their Impact

Step 3: connect trends to context and goals
Integrate the identified trends with the insights from Question 1 (Market Definition) and Question 2 (Competitor Analysis) to form a comprehensive market context.
Align Trends with Key Benefits:
Map trends to the benefits you identified earlier (e.g., performance, sustainability, trust) to see how trends influence your competitive positioning.
Example: Consumer Sustainability Focus supports brands with strong sustainability credentials like GreenClean but may hinder competitors with less sustainable practices.
Trend Impact on Goal Setting:
Accelerators: Set ambitious goals leveraging these trends (e.g., digital transformation to enhance efficiency).
Brakes: Adjust goals or create mitigation strategies to overcome barriers (e.g., adapting pricing strategies to inflation).
Step 4: visualize trends and their Influence
Create a summary visualization to help decision-makers clearly see the trend dynamics.
Example application: Tesla
Trends Influencing Tesla:
Electric Vehicle Adoption (Accelerator): Rapid adoption globally, driving demand for Tesla's products.
Raw Material Costs (Brake): Rising lithium costs impacting battery production expenses.
Autonomous Driving Innovation (Accelerator): Advances in AI bolster Tesla’s self-driving features.
Sustainability Regulations (Accelerator): Policies favoring EV adoption enhance Tesla’s market opportunities.
Geopolitical Tensions (Brake): Supply chain disruptions due to global conflicts.
Impact on Tesla's Goals:
Leverage accelerators like EV adoption to set ambitious revenue growth targets.
Address brakes like raw material costs through cost optimization or partnerships.
Final Thoughts
Identifying and assessing trends helps businesses future-proof their strategies. By understanding whether trends act as accelerators or brakes, you can:
Align your goals with external opportunities.
Mitigate risks to ensure sustainability.
Create a clear, actionable path toward achieving your objectives.
What trends are shaping your market? Share your thoughts and experiences in the comments!

Defining Your Goals: Turning Insights into Actionable Revenue Targets
Turn your market insights into actionable revenue goals with the Marketing Canvas process. Learn how to use the revenue formula—customers, transactions, and average price per transaction—to set clear, data-driven targets. Align your goals with market opportunities, competitor positioning, and emerging trends to create a strategy that delivers growth. Discover actionable examples and frameworks to guide your approach.
With insights from Question 1 (Market Definition), Question 2 (Competitor Analysis), and Question 3 (Trend Analysis), you now have a clear understanding of your market, competitors, and trends shaping your industry. The next step in the Marketing Canvas process is to translate this knowledge into financial hypotheses and set quantitative goalsthat serve as benchmarks for success.
Your goals will be rooted in the revenue equation:
Revenue = Customers × Transactions × Average Price per Transaction
Step 1: Define your financial hypotheses
Start by linking the insights from the three market questions to each growth lever in the revenue equation.
1. Customers
Question 1: How large is your addressable market (TAM/SAM/SOM)?
Example: If your SAM is growing, focus on acquisition (GET strategy).
Question 2: How does your offering compare to competitors in perceived benefits (M9)?
Example: If you’re a challenger, leverage your unique strengths to attract new customers.
Question 3: What trends influence customer behavior?
Example: Social trends like sustainability might help you acquire eco-conscious consumers.
2. Transactions
Question 1: How frequently do customers interact with your product/service?
Example: Subscription models or habitual usage patterns could encourage consistent purchases.
Question 2: Are competitors driving repeat transactions through cross-selling or upselling?
Example: Competitors may use targeted promotions to increase purchase frequency.
Question 3: What trends drive increased engagement?
Example: Digital transformation enables seamless reordering or auto-renewal subscriptions.
3. Average Price per Transaction
Question 1: What is the price sensitivity in your market?
Example: Luxury segments might allow for premium pricing, while mass-market segments may not.
Question 2: How does your perceived price (M8) compare to competitors?
Example: If you have a strong perceived benefits score (M9), you may justify a higher price point.
Question 3: What trends impact pricing?
Example: Economic trends like inflation or demand for premiumization could shape your pricing strategy.
Example Financial Hypothesis:
Based on these insights, a business might define the following hypothesis:
Increase the customer base by 15% using sustainability-driven acquisition campaigns.
Boost transaction frequency by 10% with loyalty incentives.
Raise average price by 8% through premium features and bundles.
Step 2: Set quantitative goals for revenue
Translate your financial hypotheses into measurable revenue targets, broken down into the components of the revenue equation.
Example: Revenue goal breakdown
Current revenue: €1,000,000
Target revenue: €1,300,000 (+30%)
Revenue Breakdown:
Customers: Increase from 10,000 to 11,500 (+15%)
Linked Insight: Your SAM indicates a potential for 20% growth.
Transactions per customer: Increase from 2.0 to 2.2 (+10%)
Linked Insight: Competitor analysis shows a successful subscription model driving higher frequency.
Average price per transaction: Increase from €50 to €54 (+8%)
Linked Insight: Trends highlight premiumization as an opportunity to increase price mix.
How Market Insights Drive Goal-Setting
Here’s how the three market questions guide your financial goals:
Market definition (Question 1):
Use TAM/SAM/SOM to understand potential customer acquisition targets.
Identify where your offering fits within the growth and experience curves (M3, M4).
Competitor analysis (Question 2):
Leverage perceived price (M8) and benefits (M9) to define customer acquisition and pricing strategies.
Use competitor insights to identify gaps and opportunities in transaction frequency or price mix.
Trend analysis (Question 3):
Align goals with accelerators and brakes.
Example: Sustainability trends might drive both customer acquisition and higher pricing.
Final Thoughts
Defining financial hypotheses and setting quantitative goals creates a solid foundation for aligning your strategy with market realities. By using insights from Questions 1–3, you ensure that your goals are not only ambitious but also achievable.
The next step will assess each dimension of your strategy to determine whether it helps or hinders your ability to achieve these goals.
What financial hypotheses are you setting for your business? Share your approach in the comments!

The Intersection of Growth Curve and Experience Curve: A Strategic Framework for Market Positioning
Understanding where your market stands and how your offerings align with customer expectations is critical to success. By merging the Growth Curve—which tracks a market's lifecycle through stages like Introduction, Growth, Maturity, and Decline—with the Experience Curve, you gain a clear roadmap for creating value.
In today’s fast-evolving business landscape, understanding where your market stands and how your offerings align with customer expectations is critical to success. Two powerful tools to guide this understanding are the Growth Curve and the Experience Curve. By combining these frameworks, businesses can better navigate their market’s lifecycle and create value in ways that resonate with their audience.
This blog post introduces a strategic table that merges the four stages of the Growth Curve (Introduction, Growth, Maturity, Decline) with the four stages of the Experience Curve (Commodity, Product, Service, Experience). Together, they offer a comprehensive map for positioning your product or service.
Understanding the growth curve
The Growth curve outlines the lifecycle of a market, illustrating how industries evolve over time. The four stages are:
Introduction: A new market emerges, requiring education and awareness.
Growth: Demand increases rapidly, and competition intensifies.
Maturity: The market stabilizes, with slower growth and higher saturation.
Decline: Demand decreases, and alternatives or innovations replace traditional offerings.
Understanding the experience curve
The Experience curve highlights how businesses evolve their value creation to meet customer needs. The four stages are:
Commodity: The market focuses on raw, undifferentiated materials.
Product: Goods are standardized and packaged to meet basic needs.
Service: Offerings expand to include convenience and personalized solutions.
Experience: Businesses create memorable, immersive experiences that go beyond the functional.
The combined framework: Growth Curve meets Experience curve
The table below demonstrates how the Growth Curve and Experience Curve intersect, offering insights into how businesses can position their offerings at each stage of market evolution.

Applying the framework to your business
This combined framework provides actionable insights depending on where your market stands on the Growth Curve and how your offering aligns with the Experience Curve. Here’s how you can use it:
Identify Your Market Stage on the Growth Curve
Determine whether your market is in Introduction, Growth, Maturity, or Decline. For example:
If you’re in the Growth stage, demand is expanding rapidly, and competition is heating up. This calls for scaling your offerings and differentiating yourself from competitors.
If you’re in the Maturity stage, focus shifts to efficiency, retention, and maintaining a loyal customer base.
Map Your Offering on the Experience Curve
Assess whether your current offering is at the Commodity, Product, Service, or Experience level. For example:
If you’re offering a Commodity, such as unbranded raw materials, you may face price pressure and need to move up the curve by creating a Product or Service.
If you’re already delivering a Service, explore how to elevate your offering to an Experience to drive emotional engagement and loyalty.
Align Your Strategy with Market Dynamics
Use the table to find the intersection of your Growth Curve stage and Experience Curve position, and shape your strategy accordingly:
Introduction + Product: Focus on education and awareness to establish your product’s value.
Growth + Service: Scale your service to meet rising demand while maintaining quality and consistency.
Maturity + Experience: Differentiate your brand through unique, immersive experiences that add emotional value.
Decline + Commodity: Consider diversifying or innovating to stay relevant in a shrinking market.
Example: the coffee industry
Let’s apply this framework to the coffee industry:
Introduction Stage + Commodity: Coffee beans are introduced as raw commodities in emerging markets, where price is the key driver.
Growth Stage + Product: Packaged ground coffee differentiates by quality (e.g., organic certification).
Maturity Stage + Service: Café chains offer convenience and standardized experiences, like Starbucks’ loyalty programs.
Maturity Stage + Experience: Specialty coffee shops create immersive events, such as coffee tasting sessions or farm-to-cup storytelling.
Decline Stage + Commodity: Traditional coffee markets face competition from substitutes (e.g., tea or energy drinks), requiring innovation or diversification.
Final thoughts
The combination of the Growth Curve and Experience Curve offers a powerful lens to evaluate your market and craft strategies that resonate with customers. Whether you’re navigating the early stages of a market or trying to differentiate in a mature industry, this framework helps you align your offerings with both market dynamics and customer expectations.
Take the time to map your business using this table. It will not only clarify where you stand but also illuminate the path forward, helping you stay competitive and relevant in a rapidly changing world.
What stage is your business in, and how are you creating value? Share your thoughts in the comments!

Beyond the 4Ps: The Marketing Canvas Approach and the Power of Understanding Customer Aspirations
Explore the transformation of marketing strategies as we compare the traditional 4Ps approach with the customer-aspiration-focused Marketing Canvas. Discover how understanding customer dreams and ideals can lead to more effective marketing strategies and stronger customer relationships.
The classic 4Ps marketing approach (Product, Price, Place, Promotion), commonly associated with E. Jerome McCarthy rather than Michael Porter, offers a valuable framework for understanding the tactical side of marketing. It focuses on the product and its related aspects to satisfy customer needs and maximize profits.
However, the Marketing Canvas approach, with its emphasis on ASPIRATIONS and other dimensions, provides a more holistic and strategic perspective. It delves deeper into understanding customers’ motivations, dreams, and ideals—areas that the traditional 4Ps might not fully capture. Here are a few key differences:
Customer-Centricity
The Marketing Canvas places the customer at the center, focusing on their aspirations and the value they seek. In contrast, the 4Ps approach is more product-centric, concentrating on how the product meets the customer's needs.
Brand and Value Proposition
The Marketing Canvas also highlights the importance of the brand and its value proposition. It acknowledges that today’s customers don’t just buy products or services; they invest in a brand's values and mission.
Journey and Conversation
The Marketing Canvas takes into account the entire customer journey and ongoing conversations. It recognizes the significance of engagement, interaction, and relationship-building—elements the 4Ps framework may not explicitly address.
Metrics
Finally, the Marketing Canvas places a strong emphasis on metrics, allowing businesses to measure and track the effectiveness of their marketing strategies. This creates a more data-driven approach to decision-making.
In summary, while the 4Ps approach provides a solid foundation for marketing tactics, the Marketing Canvas offers a broader, more strategic view. It delivers a more comprehensive understanding of the customer and their aspirations, which can lead to more effective marketing strategies and stronger customer relationships.

Quick Assessment Guide
Happy to announce that a one-pager quick assessment guide is now available for download. Sometimes before doing a full assessment which is really what the method is all about, some persons or companies might appreciate a first quick assessment for opening the discussion. Even though we are missing the nuances provided by the full version, it can be a nice conversation starter.
Happy to announce that a one-pager quick assessment guide is now available for download. Sometimes before doing a full assessment which is really what the method is all about, some persons or companies might appreciate a first quick assessment for opening the discussion. Even though we are missing the nuances provided by the full version, it can be a nice conversation starter.


Marketing Canvas - Step 1 - Market Assessment
Explore the intricacies of the Marketing Canvas method through an in-depth guide, enhanced with a case study from the eco-friendly cleaning products industry. Ideal for marketers and entrepreneurs seeking to build a robust marketing strategy.
Last update: 12/05/2023
Introduction
Understanding the concept of a 'market' is fundamental to crafting a successful marketing plan. But what does 'market' truly mean in a marketing context?
When you introduce products or services to fulfill specific needs, there's a high probability that alternatives already exist. These alternatives set a frame of reference for customers, leading them to compare your offerings against what they know:
Is it more expensive or cheaper?
Does it offer more or less perceived benefits?
Why should they switch to your product?
Three Crucial Questions for Your Market
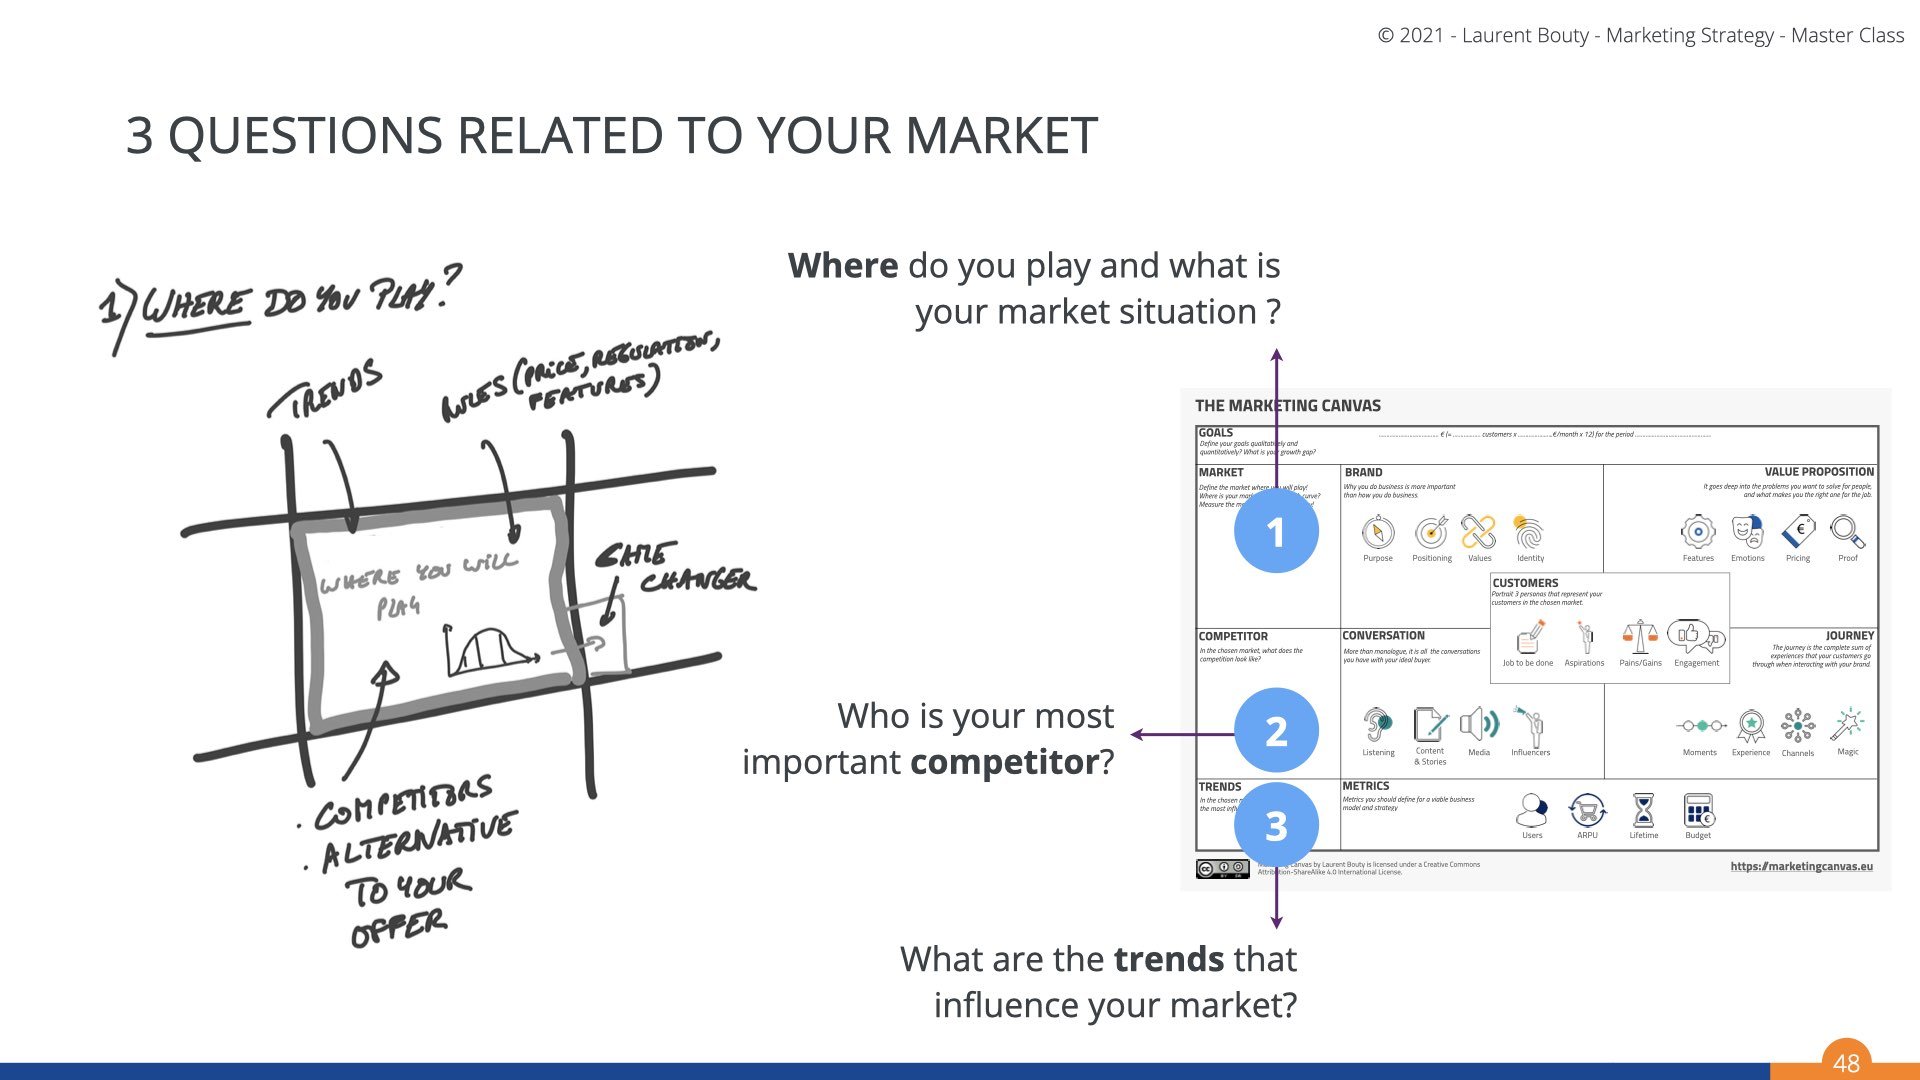
Question 1: What is your playing field, and how would you describe your market dynamics?
In marketing, we often segment territories into groups exhibiting similar characteristics, referred to as 'market segments' or 'markets'. This segmentation streamlines sales efforts, as your primary goal becomes convincing customers within your targeted market to choose and retain your value proposition.
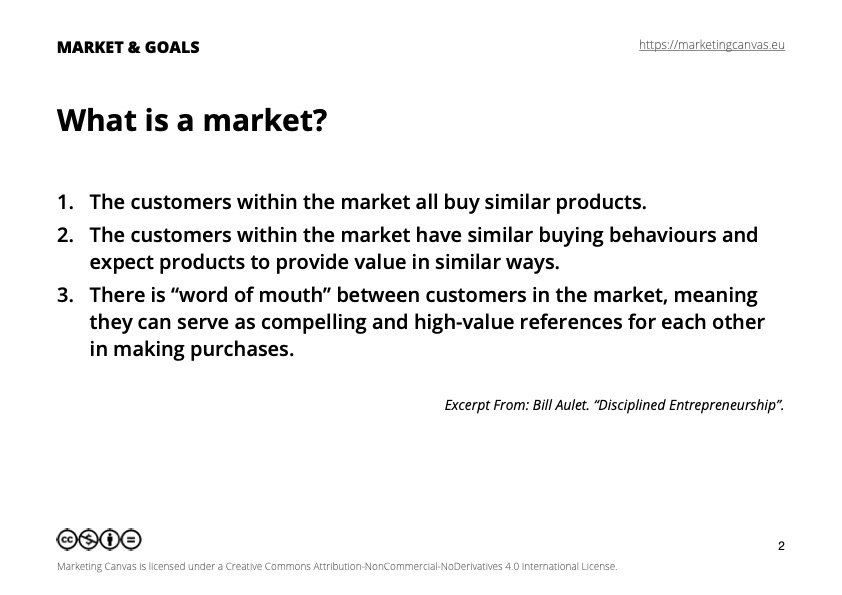
I rely on Bill Aulet's definition (Excerpt From: Bill Aulet. "Disciplined Entrepreneurship") to clarify what constitutes a market:
Customers within the market purchase similar products.
Customers within the market exhibit similar buying behaviors and anticipate similar value from the products.
There's "word of mouth" among customers in the market, meaning they serve as high-value references for each other in making purchases.
To illustrate, consider these examples:
Buying a car or a computer places you in the Car market and Computer market respectively. These markets align with Aulet's definition.
If you're a strategic consulting firm or a law firm, there likely exists a market for strategic consulting services and a market for legal services, respectively. Again, these markets align with Aulet's definition.
This concept of a market applies to both consumer and business services. Moreover, markets can be subdivided into sub-markets, providing a finer granularity to develop a marketing strategy. For instance, the Car market can be split into SUV and Sedan sub-markets, and the Computer market into Laptop and Desktop markets.
This subdivision forms a crucial step in devising a marketing strategy as it allows for an improved understanding of the context. The silver lining is that this work is often already accomplished, and markets are defined by the existing players. A wealth of data and statistics on different markets can be found on the internet, available free or for purchase.
Remark: you can compete in different markets, however the marketing canvas method has been designed for one market as competitors and conditions might change between markets. In case you would like to analyse multiple markets, you should do it one by one and then consolidate all the assessments in one strategy.
Case Study: Green Clean
Consider the eco-friendly cleaning products market. Companies like Method, Ecover, Seventh Generation, Mrs. Meyer's, and Green Clean offer alternatives to traditional cleaning products. They all compete within the eco-friendly cleaning products market, defined by customers' preference for environmentally conscious choices, similar buying behaviors, and the potential for word-of-mouth recommendations. These companies have different pricing strategies and perceived benefits, which customers will compare before making a decision.
CASE STUDY: Tesla Model S
Consider the Tesla Model S. It belongs to the broad market of cars, but we can further narrow this down into sub-markets. A common mistake is to categorize the Tesla Model S under the market of electric cars. However, being electric is a feature, not a market. Although both a Toyota Prius and a Tesla Model S are electric cars (one being a hybrid), they do not belong to the same market. The Tesla Model S fits into the Luxury E automobile or Executive/Mid-size luxury market, which also includes vehicles like the Porsche Taycan or the BMW 5 series.

As we delve deeper, we'll discover that once we have identified the market where our value proposition will compete, it's crucial to understand and follow a set of rules to shape our commercial strategy.
After identifying your company's competitive market, we need to delve into the specifics. Just like a painter cannot create art without understanding their canvas, a marketer cannot formulate a strategy without understanding their market.
1.1 Market Definition (M1)
To define your market, you must understand what product or service you are selling and who will likely buy it. For example, if you're selling eco-friendly cleaning products, your market might be environmentally conscious homeowners.
1.2 Key Expected Benefits (M2)
This involves identifying what the players in the market hope to gain. This includes both functional benefits (e.g., eco-friendly cleaning products that effectively clean the house) and emotional benefits (e.g., feeling good about contributing to environmental conservation).
1.3 Market's Position on Growth Curve (M3)
Every market undergoes stages: introduction, growth, maturity, and decline. Understanding where your market is on this curve helps you strategize accordingly. For instance, an emerging market might require more education and awareness efforts.
1.4 Experience Economy Curve of the Market (M4)
This refers to how the market evolves from selling simple commodities to providing sophisticated experiences. For instance, coffee can be sold as a commodity (beans), a product (packaged coffee), a service (brewed coffee in a cafe), or an experience (gourmet coffee tasting).
1.5 Total Available Market (TAM) and Serviceable Available Market (SAM) (M5)
TAM is the total market demand for a product or service, while SAM is the segment of TAM targeted by your company's products and services within your geographical reach. These metrics help assess the market size and opportunity.

Question 2: who is your main important competitors?
Identifying and analyzing your competitors is just as crucial as understanding your market.
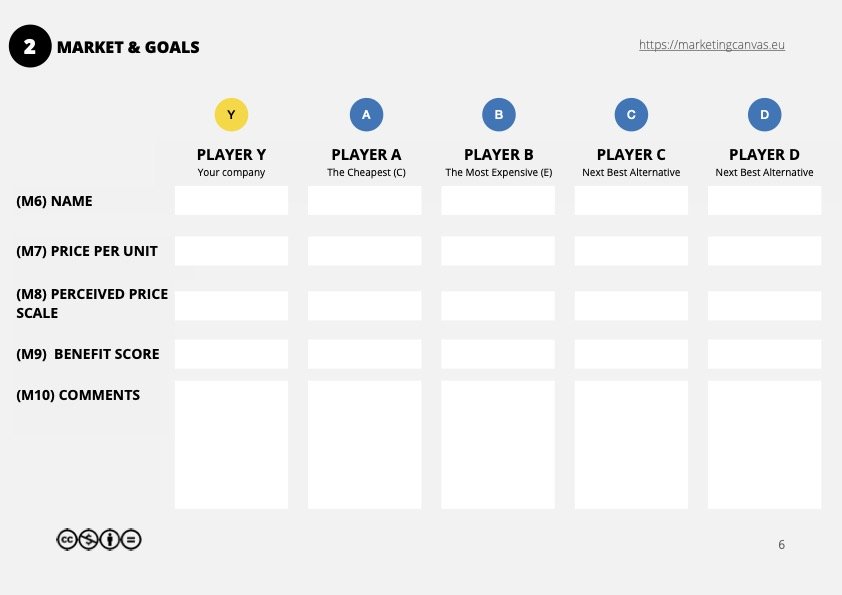
2.1 Competitors' Identification (M6-M10)
Identify up to five main competitors in your market. For each, identify the product price per unit (M7), perceived price (M8), perceived benefits (M9), and any additional remarks (M10).
2.2 Perceived Price (M8)
Perceived price is a metric that reflects how customers perceive your price relative to the competition. It is not always about the actual cost but rather the perceived value for money. The perceived price is calculated using a formula: M8 = 24/(E-C) * (M7-C) - 12.
Here, E is the maximum price per unit in the market, C is the lowest price per unit, and M7 is your product's price per unit. The calculation generates a score on a scale of -12 to +12, helping you understand your product's perceived price positioning in comparison to competitors.
Let's consider an example in the eco-friendly cleaning products market. We'll analyze five companies: GreenClean (our company), EcoPure, NatureFresh, Clean&Green, and BioWash.

Here's the calculation for GreenClean's perceived price:
M8 = 24/($15-$6) * ($10-$6) - 12 = 24/9 * 4 - 12 = 10.67 - 12 = -1.33
The same calculation is applied to find the perceived prices for the rest of the companies. This table helps you understand how your product's price is perceived relative to the competitors in the market.
In this case, GreenClean's price is perceived to be lower than most of its competitors, which can be an advantage if customers are price sensitive. However, you also need to ensure that the lower price doesn't lead customers to perceive it as lower quality.
2.3 Perceived Benefits (M9)
This is a measure of the benefits a customer perceives when interacting with a company. The perceived benefit score is calculated by summing up the scores of four questions related to the Brand, Value Proposition, Customer Journey, and Conversations offered by the company in the chosen market.
Here's how to handle each question:
Brand Perception: Ask yourself, "Is the company's brand the highest perceived amongst all the alternatives in the market?" This isn't just about brand recognition; it's about the positive associations customers make with your brand. It could be related to quality, trust, innovation, or social responsibility.
Value Proposition: Consider, "Is the company's value proposition the highest perceived amongst all the alternatives in the market?" The value proposition is the unique mix of product, price, placement, and promotion that the company offers. It answers why a customer should buy from you rather than your competitors.
Customer Journey: Query, "Is the company's customer journey the highest perceived amongst all the alternatives in the market?" The customer journey comprises all interactions between the customer and the company. It can include the ease of navigating your website, the clarity of product information, the efficiency of the checkout process, after-sales service, and more.
Conversation: Reflect on, "Is the company's conversation the highest perceived amongst all the alternatives in the market?" Conversations refer to the communication between the company and its customers. This could include advertising messages, social media interactions, customer service interactions, and more.

For each of the four questions, rate your agreement on a scale of -3 (completely disagree) to +3 (completely agree). Sum up these ratings to derive the Perceived Benefits score (M9).
This score gives you an understanding of your company's strengths and areas of improvement from the customer's perspective. It provides insights into how you can enhance your customers' experience, strengthen your value proposition, and ultimately, increase your market share.
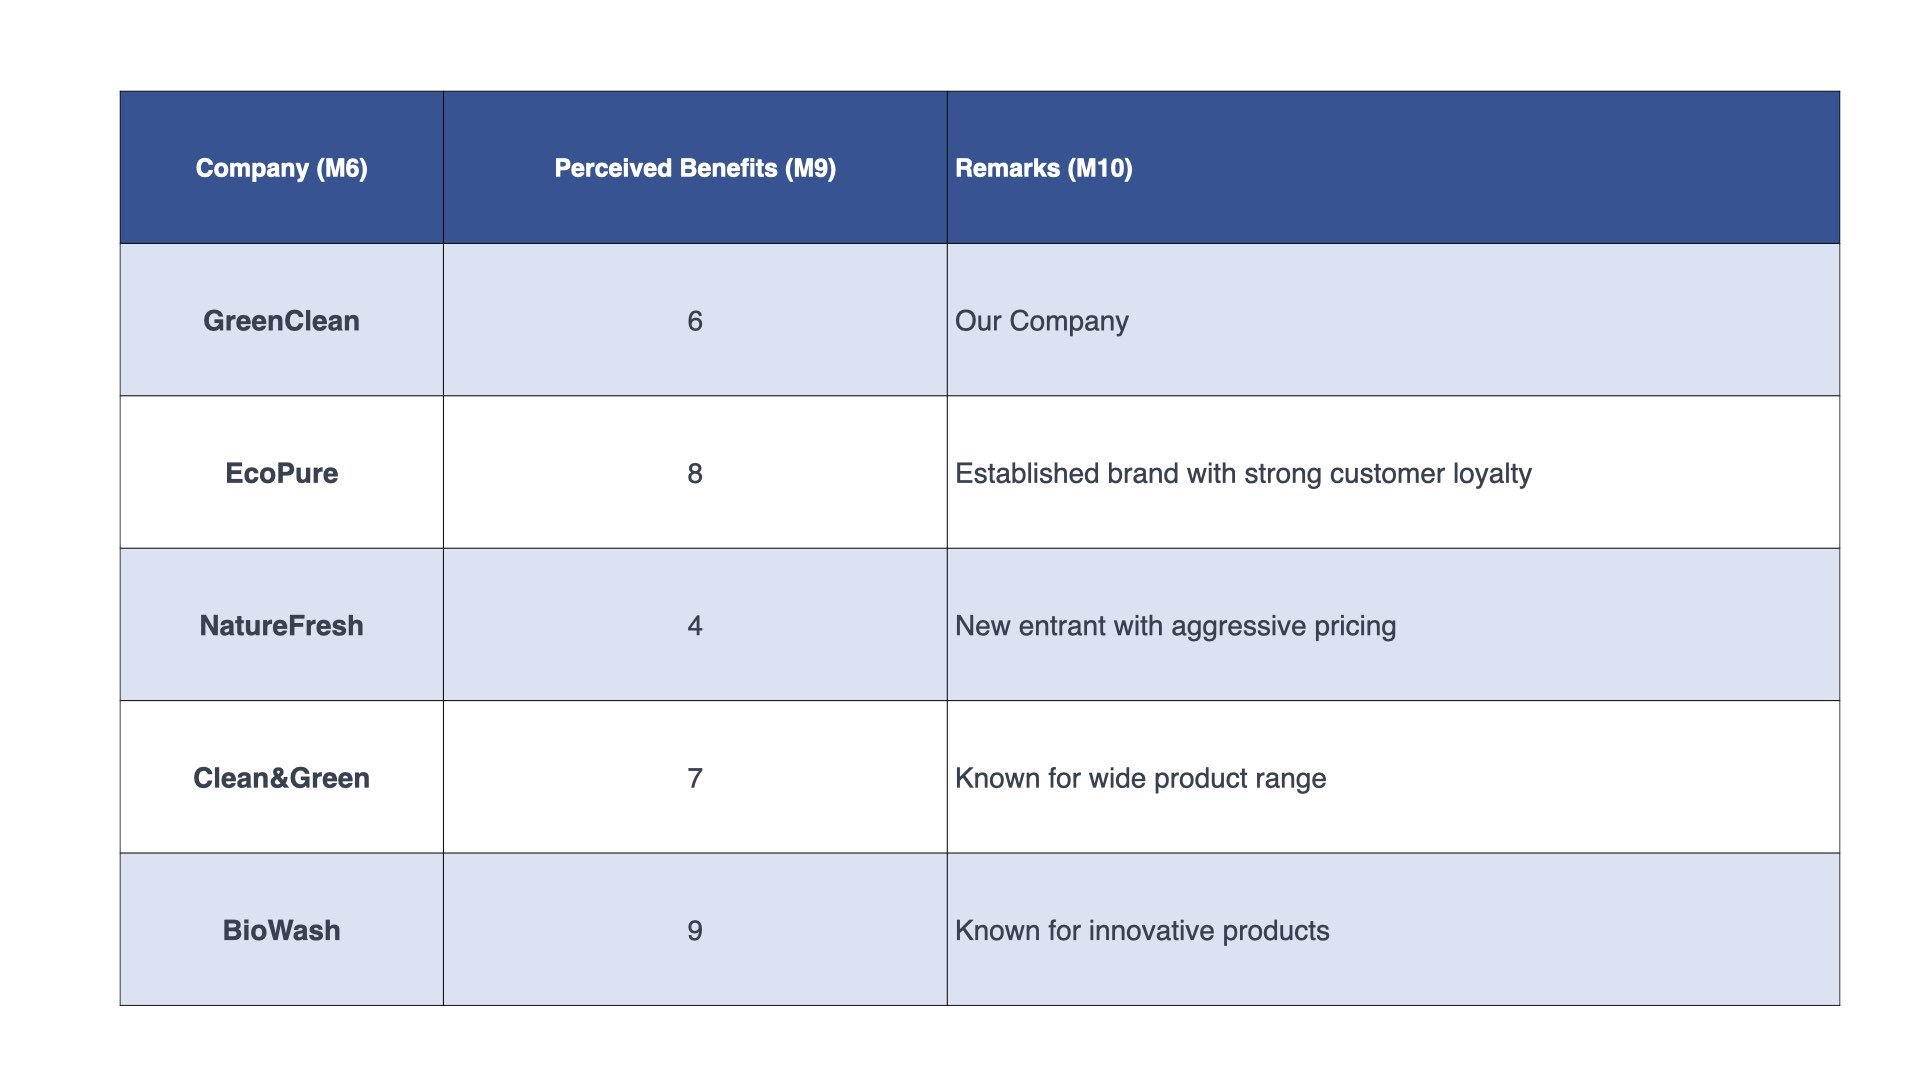
These perceived benefits scores indicate how each company's offerings are viewed in the market. GreenClean, for instance, scores fairly well, suggesting its customers appreciate its brand, value proposition, customer journey, and conversations. However, there's room for improvement, especially when compared to competitors like EcoPure and BioWash. This analysis can help guide strategic decisions to improve these areas and enhance customer perception.
question 3: what are the trends influencing your market?
This stage involves compiling all the information gathered above and creating a comprehensive view of your market.
Describe your chosen market, ensuring it aligns with the market definition of Bill Aulet.
Fill in a template (template #2) with information on your company and a maximum of 4 other companies.
Identify the average unit price for the company value proposition in the market (M7).
Map this average price for all companies using the formula: M8= 24/(E-C)*(M7-C)-12.
Calculate for each company the Perceived Benefits M9 by summing up the results of the 4 questions.
Map these results on a graph with perceived benefits (M9) on the horizontal axis (scale -12 to + 12) and perceived prices (M8) on the vertical axis (scale -12 to +12). This visualization (template #4) gives a clear picture of where each competitor stands in terms of value for money in the eyes of customers.

In conclusion, the market you're operating in, or planning to penetrate, defines the rules of the game. Understanding these rules, and how to play within them, will significantly influence your chances of success.
Whether it's the luxury electric car market or the eco-friendly cleaning products market, your marketing strategy should be rooted in a deep understanding of the market dynamics. This includes not only identifying your competitors but also comprehending the perceived price and benefits that your product or service brings to the table.

Marketing Canvas Method - Market Assesment Process
Tips for non-marketers and entrepreneurs
1. Stay Curious: Regularly research and keep up with trends in your market. It's not a one-time activity but a continuous process.
2. Talk to Customers: They can provide valuable insights that even the most sophisticated analysis might miss. Regular feedback from customers is a goldmine of information.
3. Keep an Eye on Competitors: Competitors can provide valuable lessons. Their successes and failures can provide insights for your own strategy.
4. Iterate: A marketing strategy is not set in stone. It evolves with your business, market trends, and customer preferences. Regularly revisit and update your strategy based on new data and insights.
Remember, understanding the context is just the first step in the marketing canvas method. It sets the foundation for the other steps in the process, guiding the direction of your marketing strategy.

Marketing Canvas - Step 2 - Set Your Goals
In the Marketing Canvas Process, after having finalised your assessment, you should discuss potential scenarios that will help you achieve your goal(s). An interesting perspective for this phase is to use the scenarios proposed by Tiffani Boffa in her book Growth IQ.
The Marketing Canvas, developed by Laurent Bouty, is a powerful tool that provides a structured approach to crafting a robust marketing strategy. It's a co-creation method that intersects your environment (where you will play), your goals (what you would like to achieve), and your actions (what you will do). This article focuses on the second step of the Marketing Canvas Process - setting your goals. This step is vital as it serves as the reference point for the assessment phase.
Three Strategies for Growing Your Revenue:
In the Marketing Canvas Process, three strategies are highlighted for growing your revenue: GET, KEEP, and STIMULATE/MORE. These strategies focus on different aspects of customer interaction and are designed to help businesses increase their revenue.
GET: This strategy is all about customer acquisition. The primary idea is that your business can grow by attracting new customers. Tactics that can be employed include acquisition campaigns (welcome offers), channel incentives for new customers, "bring a friend" campaigns, and freemium models. For instance, a new restaurant might offer a "buy one get one free" deal to attract new customers.
KEEP: The second strategy emphasizes customer retention. The main idea here is that your business can grow by retaining existing customers. This strategy might seem defensive, but it is the cornerstone of customer experience and is essential for all businesses, including startups. Tactics include churn management, loyalty programs, brand and customer experience reinforcement, Net Promoter Score (NPS) programs for detractors, and below-the-line retention campaigns. For example, a software-as-a-service (SaaS) company might implement a loyalty program that offers exclusive features or discounts to long-term subscribers.
STIMULATE/MORE: The third strategy focuses on customer stimulation. The primary idea is that your business can grow by encouraging your customers to spend more and/or more often. Tactics include cross-selling, upselling, promotion campaigns for usage stimulation, bundling, upgrade programs, and premium features. For instance, a telecom company might offer a bundle that includes internet, cable, and phone services at a discounted rate, encouraging customers to spend more.
Green Clean Use Case:
To illustrate these strategies, let's consider a hypothetical company, Green Clean, a startup offering eco-friendly cleaning services.
For the GET strategy, Green Clean could offer a discounted first cleaning service to attract new customers. They could also implement a referral program where existing customers get a discount for each new customer they bring in.
For the KEEP strategy, Green Clean could develop a loyalty program where customers get a free cleaning service for every ten services purchased. They could also focus on providing excellent customer service to ensure customer satisfaction and reduce churn.
For the STIMULATE/MORE strategy, Green Clean could offer additional services like deep carpet cleaning or window cleaning, encouraging existing customers to spend more. They could also offer a premium subscription service that includes regular cleaning and maintenance services.
Conclusion
Setting your goals is a crucial step in the Marketing Canvas Process. It provides a clear direction for your marketing efforts and serves as a reference point for assessing your progress. The three strategies - GET, KEEP, and STIMULATE/MORE - offer different approaches to growing your revenue. By understanding these strategies and how to apply them, businesses can create a robust marketing strategy that drives growth and success.
Remember, the Marketing Canvas is a dynamic tool. As your business environment changes, you should revisit your goals and strategies to ensure they remain relevant and effective. Regular review and adaptation are key to maintaining a successful marketing strategy.
Whether you're a non-marketer, an entrepreneur, or a marketer looking to learn something new, the Marketing Canvas offersa structured yet flexible approach to developing a marketing strategy. It breaks down complex marketing concepts into manageable steps, making the process more accessible and less intimidating.
The Marketing Canvas is not just a tool, but a journey. It's a process of discovery, assessment, and reinforcement. It's about understanding your market, setting clear goals, and determining the actions you need to take to achieve those goals.
So, are you ready to embark on this journey? Are you ready to set your goals and grow your business? Remember, the journey of a thousand miles begins with a single step. In the case of the Marketing Canvas, that step is setting your goals.

Marketing Canvas - Budget
Discover the importance of a well-structured marketing budget in our comprehensive guide. We delve into the critical role of budgeting within the Marketing Canvas method by Laurent Bouty. Learn how to track and manage marketing expenses, whether you're a multinational corporation or a budding startup. Understand the significance of budgeting in terms of industry benchmarks, and discover strategies to spend wisely. Our guide offers practical tools to translate your budget into action, from understanding your audience to tracking expenses effectively. Moreover, learn to evaluate and improve your budgeting practices with our score-based self-assessment. Lastly, get inspired by a real-life example of green clean use case. Whether you're a marketing novice or an entrepreneur seeking new insights, this article offers an essential exploration of the powerful tool that is your marketing budget.
Last update: 10/12/2024
In a nutshell
Discover the importance of a well-structured marketing budget in our comprehensive guide. We delve into the critical role of budgeting within the Marketing Canvas method by Laurent Bouty. Learn how to track and manage marketing expenses, whether you're a multinational corporation or a budding startup. Understand the significance of budgeting in terms of industry benchmarks, and discover strategies to spend wisely. Our guide offers practical tools to translate your budget into action, from understanding your audience to tracking expenses effectively. Moreover, learn to evaluate and improve your budgeting practices with our score-based self-assessment. Lastly, get inspired by a real-life example of green clean use case. Whether you're a marketing novice or an entrepreneur seeking new insights, this article offers an essential exploration of the powerful tool that is your marketing budget.
In the Marketing Canvas
The Marketing Canvas is a powerful tool for entrepreneurs and non-marketers to build a robust marketing strategy. It consists of six meta-dimensions, each with four sub-dimensions, for a total of 24 sub-dimensions defining your Marketing Strategy. One of these sub-dimensions is BUDGET, which falls under the METRICS meta-category.
Defining Budget
The Marketing Canvas model proposed by Laurent Bouty offers an in-depth methodology to conceptualize and structure your marketing plan. The fundamental section Bouty underscores is "Metrics," and the sub-dimension "Budget" within it. This sub-dimension serves as a barometer to quantify and keep track of your marketing expenditure, a crucial determinant of your company's marketing efforts' overall success.
The Budget dimension's relevance is ubiquitous, regardless of your company's size. For larger conglomerates, where tracking expenses becomes a standard protocol, marketing becomes an essential cog in the wheel. Conversely, smaller entities like startups or SMEs may not implement such stringent measures, overlooking the importance of earmarking a designated marketing budget, which could potentially hinder growth.
Renowned benchmarks, Gartner and CMOsurvey, offer a broad understanding of how companies, across industries and sizes, allocate their marketing budgets. These benchmarks divulge that, on average, about 11% of the yearly budget is dedicated to marketing expenditure. An alternative way of approaching this is by calculating the ratio between your marketing budget and your revenue. The marketing budget generally represents 6% to 10% of your revenue, a number that can fluctuate depending on your revenue size.
As per the industry suggestions, startups could consider setting aside up to 20% of the anticipated gross revenue for the marketing budget. However, the crucial takeaway here is that it is not solely about allocating funds to marketing, but ensuring that these funds are utilized judiciously. This involves associating your expenses with your actions – if you plan to perform action X to achieve objective Y, how much will Z (the budget) amount to?
Underutilizing your marketing budget can pose problems. It may create a negative impression of your leadership, indicating a lack of execution on planned strategies. Similarly, if your marketing budget falls below the market average, it may indicate under-investment compared to your competitors, acting as an impediment to your business's growth.
A survey by Sortlist conducted in 2021 revealed that the Covid19 pandemic had either positively or negatively impacted the marketing budget for SMBs. On average, the annual budget hovered around a maximum of 10,000€ for 50% of the companies surveyed. However, this figure only accounted for media and content expenses, excluding human resources and platform investments.
Tools for Budget
Having a well-planned budget is a keystone to any successful marketing strategy. However, to implement this successfully, certain tools can provide a great deal of assistance. Software platforms like QuickBooks, Zoho Books, or Sage 50cloud are excellent options for maintaining and tracking your budget. They not only help you keep your budget in check but also ensure the finances are appropriately aligned with your marketing goals.
Spreadsheets can also play a significant role in managing your budget. They provide a straightforward and uncomplicated way to input and track your budget figures. Excel or Google Sheets, with their various functions, can aid in organizing and categorizing your budget.
Moreover, platforms like HubSpot offer a dedicated Marketing Hub that includes budget management tools within their software. This feature enables companies to plan, track, and measure their marketing budgets and ROI from a single platform.
Translating Budget into Action
Translating your budget into action entails strategic decision-making. It involves a deep understanding of your audience and consistent engagement, preparedness for budget variability, consideration of the marketing lifecycle, tracking expenses, and balancing creativity with cost.
For instance, if your target audience is primarily online, then directing a significant portion of your budget to digital marketing would be a wise decision. However, for a local audience, traditional advertising methods, such as billboards or local press, may be more effective.
Maintaining consistency in your marketing approach can result in more significant outcomes than sporadic, high-cost campaigns. This strategy requires planning for sustained engagement with your audience.
Marketing budget needs can change with time. It is vital to remain flexible and adapt your budget based on business needs, market trends, and campaign results.
In marketing, some initiatives, like SEO or content marketing, may take a longer time to deliver results. It's crucial to account for these long-term strategies in your budget, alongside short-term ones.
By using accounting or budgeting software, you can keep an accurate record of your marketing expenditures. This data can provide valuable insights for future budgeting decisions.
While high-cost campaigns may appear more attractive, the most creative ideas are often the most cost-effective. Always seek to balance creativity and budget constraints.
Statements for self-assessment
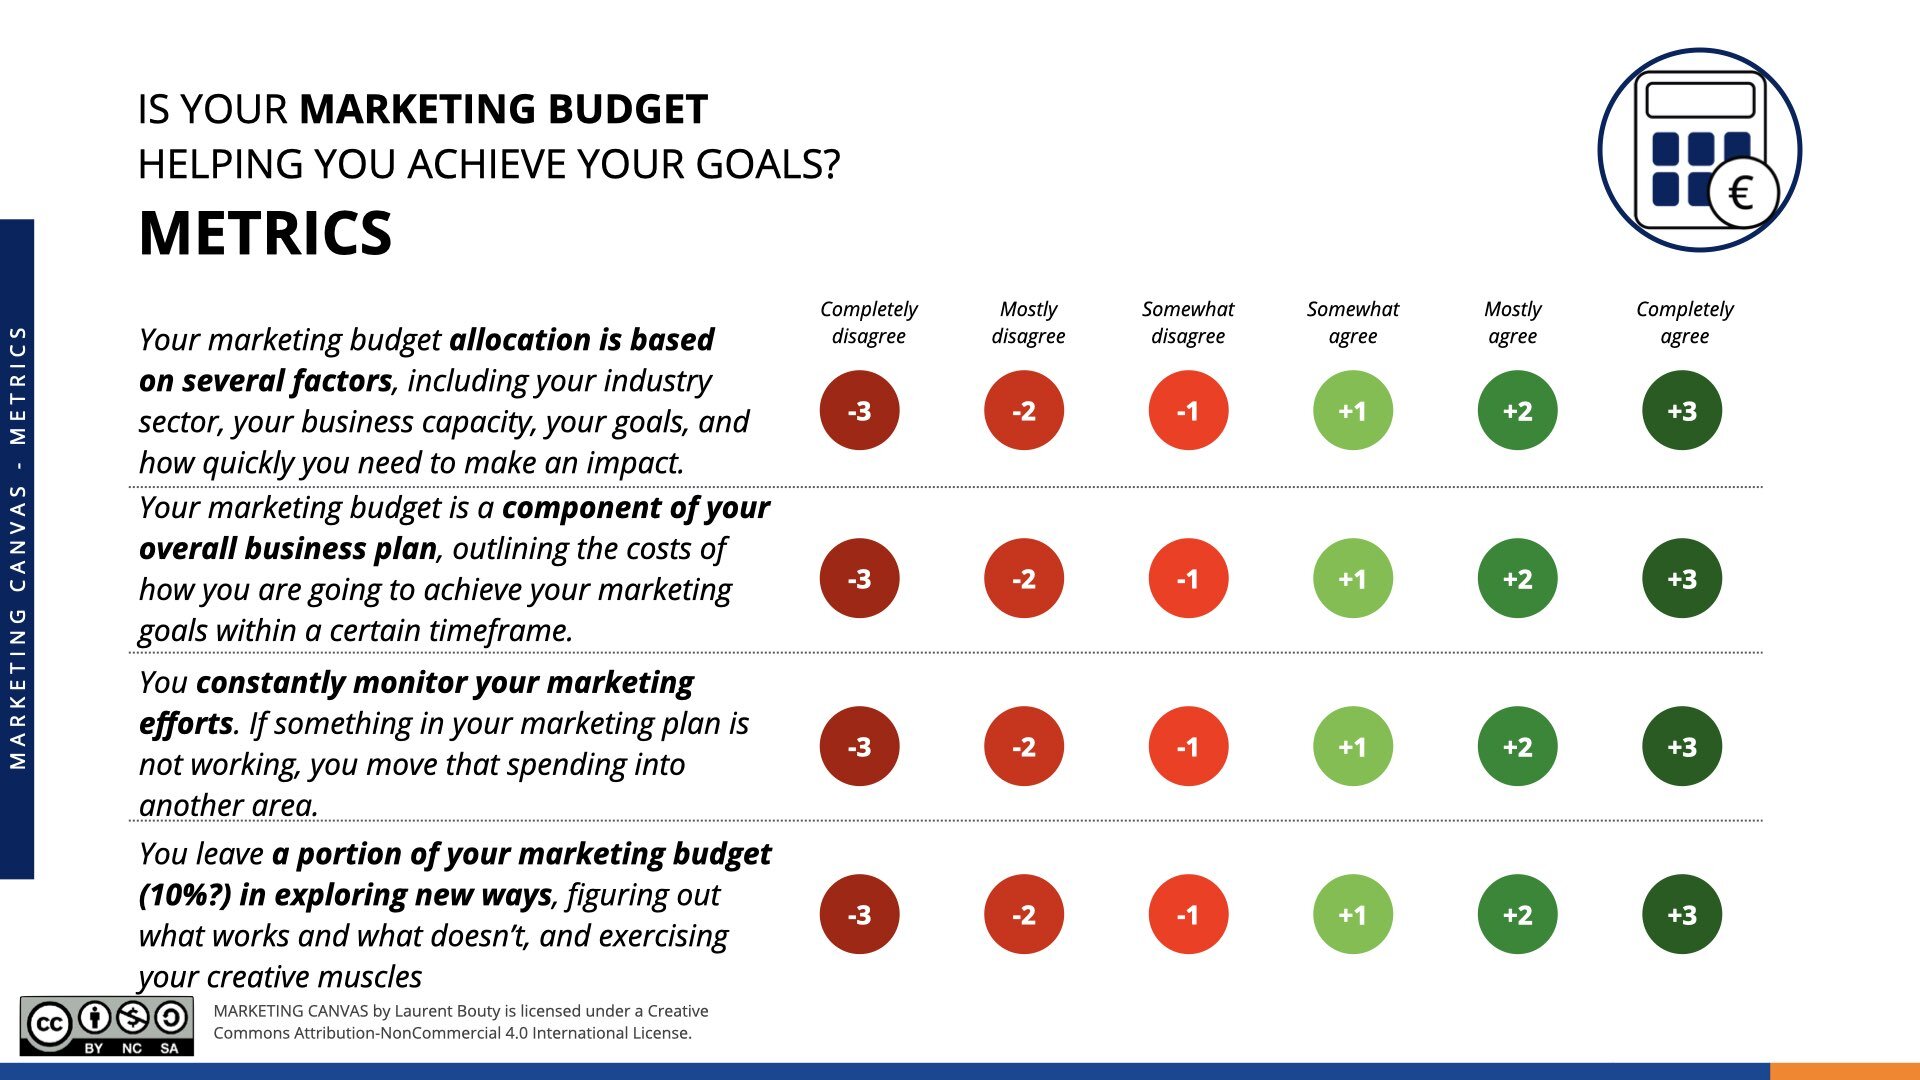
Is your Marketing Budget helping you achieve your goals?
Evaluating the effectiveness of your marketing budget is a critical step towards its optimization. Here, you assess if your budget is helping you reach your goals.
For a comprehensive evaluation, rate your agreement with the following statements on a scale from -3 (completely disagree) to +3 (completely agree):
Your marketing budget allocation is based on several factors, including your industry sector, your business capacity, your goals, and how quickly you need to make an impact.
Your marketing budget is a component of your overall business plan, outlining the costs of how you are going to achieve your marketing goals within a certain timeframe.
You constantly monitor your marketing efforts. If something in your marketing plan is not working, you move that spending into another area.
You leave a portion of your budget (10%?) in exploring new ways, figuring out what works and what doesn’t, and exercising your creative muscles
Each of these statements evaluates a critical aspect of your marketing budget. Your scores would indicate which areas need improvement, and which areas are effectively managed.
Marketing Canvas Method - Question - Marketing Budget
Interpretation of the scores
Negative scores (-1 to -3): Indicate significant gaps in your budgeting process. Resource allocation may lack strategic alignment, monitoring may be insufficient, and there may be little or no investment in innovation.
A score of zero (0): Reflects partial effectiveness. While the budget is functional, it may not be fully aligned with goals, flexible, or innovative enough to drive optimal results.
Positive scores (+1 to +3): Suggest a well-optimized budget strategy. Allocation is strategic, monitoring is robust, and there is a deliberate focus on testing and innovation.
Case Study: Green Clean’s Budget strategy
Misaligned understanding (-3, -2, -1): Green Clean allocates its marketing budget without clear alignment to business goals. The budget lacks flexibility, with no resources reserved for experimentation, leading to stagnation in results.
Surface understanding (0): Green Clean allocates a functional budget aligned with its business plan but struggles to reallocate funds from underperforming initiatives. There is minimal investment in innovation, limiting growth potential.
Deep understanding (+1, +2, +3): Green Clean’s budget is strategically allocated across campaigns, aligned with business goals, and includes 10% for experimentation. Performance is closely monitored, with resources reallocated dynamically to maximize impact.
Conclusion
The Budget sub-dimension emphasizes the importance of strategic allocation, continuous monitoring, and innovation in marketing. A well-structured budget not only aligns with business goals but also ensures flexibility and encourages creative exploration, enabling sustainable growth and competitive differentiation.
Sources
Gartner CMO Spend Survey 2020-2021, Gartner, https://www.gartner.com/en/marketing/research/annual-cmo-spend-survey-research
CMO Survey 2020, Deloitte, pdf, https://www2.deloitte.com/content/dam/Deloitte/us/Documents/CMO/us-cmo-survey-highlights-and-insights-report-feb-2020.pdf
Sortlist, 2021 Marketing Survey: Budgets, Trends and Inspiration for SMBs, https://www.sortlist.com/blog/marketing-survey-smbs-budgets-trends-inspiration/
Medium, 5 Steps to Creating a Small Business Marketing Budget, https://medium.com/@the_manifest/5-steps-to-creating-a-small-business-marketing-budget-2f807065068a
More on the Marketing Canvas


Marketing Canvas - Lifetime
The Marketing Canvas is a framework that identifies 6 main categories for building a marketing strategy: Customers, Brand, Value Proposition, Journey, Conversation, and Metrics. Lifetime is one of the 4 dimensions of the Metrics category, which is important for measuring customer retention. Customer churn rate, which measures the percentage of customers who discontinue using a company's product or service, is a critical metric for companies to monitor.
Last update: 10/12/2024
In a nutshell
This comprehensive guide delves into the significance of Average Revenue Per User (ARPU) as a potent metric in business success. Through this exploration, businesses can better understand how much revenue they generate per user and how they stack up against industry competitors. The article not only explains how to calculate and evaluate ARPU but also provides practical strategies to leverage it for sustainable growth. This includes segmenting customer bases, forecasting revenues, and even assessing the effectiveness of various growth strategies like upselling or price optimization. To illustrate the concepts, the article incorporates a real-world case study from the green cleaning industry. Whether you're an entrepreneur, marketer, or non-marketer interested in business strategy, this guide equips you with the knowledge and tools to transform ARPU from a simple number into actionable business insights.
In the Marketing Canvas
The Marketing Canvas is a powerful tool for entrepreneurs and non-marketers to build a robust marketing strategy. It consists of six meta-dimensions, each with four sub-dimensions, for a total of 24 sub-dimensions defining your Marketing Strategy. One of these sub-dimensions is LIFETIME, which falls under the METRICS meta-category.
Defining Lifetime
Customer Retention has become a pivotal concern for subscription-based businesses in recent years. The idea of prolonging your subscribers' association with your business becomes indispensable if the ultimate objective is to generate profits. The long-established belief is that retaining existing customers is more cost-efficient than acquiring new ones, typically by a ratio of 1 to 6. Although the ratio might differ, we can all concur that spending money to acquire new customers is higher than retaining existing ones. Either way, the effect on your customer base is the same (+1 customer -1 lost or evading the loss of 1 customer). We often use the concept of churn (or attrition) to gauge the number of customers departing from your service during a specified period.
Churn rate, a critical metric, represents the percentage of customers discontinuing a company's product or service over a given timeframe. This metric is critical because it provides insights into the health of a company's customer base and its ability to retain its customers. Calculating the churn rate involves dividing the number of customers lost during a specific time period (e.g., a quarter) by the number of customers the company had at the beginning of that time period.
Monitoring churn rate is paramount for companies as it offers a clear image of the number of customers leaving the company, which directly impacts the company's profitability. A high churn rate could signify subpar customer service, inadequate product offerings, or even stiff competition in the market. Hence, it becomes imperative for companies to pinpoint the reasons behind a high churn rate and initiate corrective measures to curtail it.
Furthermore, tracking customer churn enables companies to evaluate how effectively they are retaining their customer base, thereby helping them adjust their customer retention strategies. Companies can exploit customer data to better comprehend their customers' needs, preferences, and behaviors, and modify their offerings and services to meet those needs. By proactively addressing the factors driving churn, companies can cultivate a more loyal customer base and secure long-term success.
Lifetime is an alternative perspective on this phenomenon. Lifetime refers to the duration (often in months) a customer stays with you. The exact specification of this definition can vary across different industries. For instance, in the mobile business, a customer must have received or made a call/SMS/data transaction during the specified period to be considered "active." One method to estimate the lifetime is by dividing 1 by your churn rate percentage. Lifetime is indicative of how successful you are at satisfying existing customers.
In the Marketing Canvas framework, we consider Lifetime as a pivotal metric. It's not a standalone number but tied intricately to your business objectives. Let's explore how it works in a scenario.
Imagine owning a business that generates €1000 a month from 1000 customers, with each spending €1. If you have a churn rate of 10%, you would lose 100 customers by the end of the first month, reducing your customer base to 900. Consequently, your revenue for the month drops to €900, presuming that the remaining customers continue to spend €1 each.
If the trend continues, you'll witness another 10% reduction in customers, leading to the loss of 90 more customers, and leaving you with only 810 customers. The impact on your revenue will be corresponding, reduced to €810. This continuous decline in revenue has a direct bearing on your business goals, making it increasingly challenging to generate profits, let alone achieve growth, when the customer base is shrinking rapidly.
To balance the loss of customers and stabilize revenue, you would need to acquire new customers at a rate faster than you are losing them. This, however, can be a costly and time-consuming task. Therefore, customer retention becomes a cornerstone for the long-term sustainability of your business.
Tools for Lifetime
A plethora of tools exist in the market today, aimed at aiding businesses in calculating and improving the lifetime of their customers.
Customer Relationship Management (CRM) Systems: CRM systems like Salesforce or HubSpot help businesses track and manage customer interactions, allowing them to understand better and increase customer lifetime value.
Subscription Management Platforms: Platforms like Chargebee or Zuora help businesses manage their subscription billing and provide insights into metrics such as churn rate and customer lifetime value.
Customer Analytics Platforms: Tools like Mixpanel or Amplitude allow businesses to track user behavior and engagement, enabling them to identify potential churn risks and take proactive measures.
Customer Feedback Tools: Tools like SurveyMonkey or Qualtrics allow businesses to gather feedback directly from customers, helping them understand the reasons for customer churn and find ways to improve customer retention.
Translating Lifetime into Action
Transforming the concept of 'Lifetime' into tangible action involves a thorough understanding of your customer base, their needs, their behaviours, and effectively addressing their pain points.
Segment Your Customers: Divide your customer base into segments based on their behaviour, usage, or revenue generated. This allows you to understand the different types of customers you have and develop strategies tailored to each segment.
Develop Customer Retention Programs: Develop strategies aimed at improving customer loyalty. This could be through a loyalty rewards program, personalized communication, or by improving customer service.
Identify At-Risk Customers: Use predictive analytics to identify customers who are at risk of churning. Once identified, you can take proactive measures to retain them.
Improve Customer Experience: Regularly review and improve your product or service based on customer feedback. Ensuring a high-quality customer experience is one of the best ways to improve customer lifetime.
Statements for self-assessment
Is the Lifetime of your users helping you achieve your goals?
It is crucial to evaluate whether your user lifetime is aiding you in achieving your business goals. For a comprehensive evaluation, you can rate your agreement with the following statements on a scale from -3 (completely disagree) to +3 (completely agree):
You are capable to measure user's lifetime (1/churn) because you know who is buying and using your products and services.
Your churn level is below or equal to average market churn level
The historical trend of your churn evolution is positive (growth) and present a positive outlook for next year.
Your CRC (Customer Retention Cost) is aligned with your CAC (Customer Acquistion Cost). CAC+CRC is 20-30% for mature business and 50-70% for startups (% of revenue).
Your scores can help pinpoint areas of strength and those requiring attention. The higher the score, the more effective your customer retention strategy is, and vice versa. It's always a good practice to revisit these scores periodically to gauge improvement or diagnose worsening situations.
Marketing Canvas Method - User Lifetime and Churn
Interpretation of the scores
Negative scores (-1 to -3): Indicate significant gaps in measuring or optimizing customer lifetime. High churn rates, poorly aligned CAC and CRC, or negative historical trends suggest the need for immediate intervention.
A score of zero (0): Reflects partial effectiveness. While some aspects of lifetime strategy are functional, inefficiencies in retention efforts or unclear data may limit overall impact.
Positive scores (+1 to +3): Suggest a well-optimized lifetime strategy. Churn is low, retention costs are aligned with CAC, and historical trends indicate sustainable growth and profitability.
Case study: Green Clean’s Lifetime strategy
Misaligned understanding (-3, -2, -1): Green Clean does not track churn accurately and struggles to identify who is using its services. Retention efforts are costly, uncoordinated, and misaligned with CAC, resulting in unsustainable operations.
Surface understanding (0): Green Clean measures churn but lacks actionable insights. While CAC and CRC are within acceptable ranges, historical trends show inconsistent retention efforts, limiting future growth potential.
Deep understanding (+1, +2, +3): Green Clean accurately measures churn and tracks customer lifetime. It reduces churn through personalized engagement and aligns CAC and CRC efficiently. Historical trends show consistent improvement, supported by sustainable retention strategies.
Conclusion
The Lifetime sub-dimension emphasizes the importance of tracking and optimizing customer lifetime to ensure sustainable growth and profitability. By reducing churn, balancing CAC and CRC, and analyzing historical trends, businesses can build stronger customer relationships and achieve long-term success.
Sources
HUBSPOT, What is customer churn, https://blog.hubspot.com/service/what-is-customer-churn
HBR, The Value of keeping the right customers, https://hbr.org/2014/10/the-value-of-keeping-the-right-customers
Hubspot, Here’s Why Customer Retention is So Important for ROI, Customer Loyalty, and Growth, https://blog.hubspot.com/service/customer-retention
More on the Marketing Canvas

Marketing Canvas - ARPU
This comprehensive guide delves into the significance of Average Revenue Per User (ARPU) as a potent metric in business success. Through this exploration, businesses can better understand how much revenue they generate per user and how they stack up against industry competitors. The article not only explains how to calculate and evaluate ARPU but also provides practical strategies to leverage it for sustainable growth. This includes segmenting customer bases, forecasting revenues, and even assessing the effectiveness of various growth strategies like upselling or price optimization. To illustrate the concepts, the article incorporates a real-world case study from the green cleaning industry. Whether you're an entrepreneur, marketer, or non-marketer interested in business strategy, this guide equips you with the knowledge and tools to transform ARPU from a simple number into actionable business insights.
Last update: 27/12/2024
In a nutshell
This comprehensive guide delves into the significance of Average Revenue Per User (ARPU) as a potent metric in business success. Through this exploration, businesses can better understand how much revenue they generate per user and how they stack up against industry competitors. The article not only explains how to calculate and evaluate ARPU but also provides practical strategies to leverage it for sustainable growth. This includes segmenting customer bases, forecasting revenues, and even assessing the effectiveness of various growth strategies like upselling or price optimization. To illustrate the concepts, the article incorporates a real-world case study from the green cleaning industry. Whether you're an entrepreneur, marketer, or non-marketer interested in business strategy, this guide equips you with the knowledge and tools to transform ARPU from a simple number into actionable business insights.
In the Marketing Canvas
The Marketing Canvas is a powerful tool for entrepreneurs and non-marketers to build a robust marketing strategy. It consists of six meta-dimensions, each with four sub-dimensions, for a total of 24 sub-dimensions defining your Marketing Strategy. One of these sub-dimensions is ARPU, which falls under the METRICS meta-category.
Defining ARPU
ARPU, an acronym for Average Revenue Per User, holds significant weight in mobile telecom businesses and, indeed, any business that operates on a user-based model. This value-oriented metric is calculated by dividing the total revenue by the number of active users within a specific time frame, typically a month. The active users, in this context, generally refer to paying customers.
At its core, ARPU is a simple and unambiguous measure that facilitates direct comparisons with competitors, customer base segmentation, and financial forecasting. A business with a higher ARPU, assuming all other factors are constant, enjoys superior profitability.
ARPU's importance is twofold. Firstly, it serves as a testament to a business's customer-centricity, if measured accurately. A company that keeps track of its ARPU has a precise understanding of which clients contribute most significantly to their revenues (the top 10%), and those whose contribution is more modest (the bottom 10%). This metric also reveals the elements contributing to the revenues for each client.

Secondly, a strategy that focuses on improving ARPU is an effective approach to business growth. In the Marketing Canvas framework, we assess whether your ARPU aligns with and advances your business goals. A low ARPU, in comparison to your competitors, implies that each new customer acquired will generate less revenue than a new customer for your competitors. This scenario represents a hurdle that may be overcome by attracting more high-value customers through a stronger brand and value proposition.
Guidelines
ARPU provides an easy, high-level benchmark to compare how much revenue one company generates from its users relative to another.
Examining ARPU by customer segments can yield valuable insights, particularly when paired with other metrics.
Many financial models start by forecasting your user numbers based on customer acquisition and retention assumptions. By multiplying this number by your ARPU, you can generate a revenue forecast.
Tools for ARPU
Calculating and tracking ARPU is straightforward, but requires the right tools. Revenue tracking software and business intelligence platforms can facilitate the process by automatically calculating ARPU over a given time period. Tools like Tableau, Microsoft Power BI, or Google Analytics are widely used for this purpose. It's crucial to ensure that these tools integrate seamlessly with your accounting or CRM systems to deliver accurate results.
Customer segmentation tools can also be helpful in analysing ARPU across different groups. For example, you might find that customers in a particular geographic area or of a certain age group have a higher ARPU. You can then focus your marketing efforts on attracting more of these high-ARPU customers.
Translating ARPU into Action
After calculating and analysing ARPU, it's time to leverage this metric to inform strategic decisions. A high ARPU relative to your competitors suggests a strong value proposition and efficient monetization. Conversely, a low ARPU may indicate the need for improvement.
If your ARPU is lower than desired, consider strategies such as upselling or cross-selling to existing customers. You could also revise your pricing strategy or explore new revenue streams. For instance, a SaaS company with a low ARPU might consider launching a premium tier of service.
Another way to increase ARPU is by refining your marketing efforts to attract high-value customers. By analyzing customer segments, you can identify the characteristics of your highest-value customers and then target similar prospects.
Statements for self-assessment
Is the ARPU of your users helping you achieve your goals?
Assessing ARPU is vital to gauge whether it aids in attaining your objectives. To evaluate comprehensively, rate your agreement with the below statements on a scale from -3 (completely disagree) to +3 (completely agree):
You are capable to measure Average Revenue per User because you know who is buying and using your products and services.
The average purchase frequency of your users is above industry average and above direct competitors.
The average spending of each purchase of your users is above industry average and above direct competitors.
The historical trend of your ARPU evolution is positive (growth) and present a positive outlook for next year.
In addition to these statements, consider how ARPU interacts with other important metrics like Customer Acquisition Cost (CAC) and Customer Lifetime Value (CLTV). For example, a high ARPU is even more beneficial if it is combined with a low CAC, leading to a high CLTV/CAC ratio.
Interpretation of the scores
Negative scores (-1 to -3): Indicate significant gaps in understanding or optimizing ARPU. You may lack the data or strategies needed to measure purchase behavior, spending, and trends effectively, resulting in missed growth opportunities.
A score of zero (0): Reflects partial effectiveness. While ARPU is tracked, there are inconsistencies in measurement or missed opportunities for improvement. Additional focus on frequency, spending, or sustainability is needed.
Positive scores (+1 to +3): Suggest a strong ARPU strategy. Metrics are well-tracked and aligned with business goals, exceeding industry benchmarks while supporting long-term customer value and sustainability.
Case study: Green Clean’s ARPU strategy
Misaligned understanding (-3, -2, -1): Green Clean lacks clear data on who buys and uses its products. Purchase frequency is sporadic, spending per transaction is low, and historical ARPU trends show stagnation or decline.
Surface understanding (0): Green Clean measures ARPU but struggles to align it with industry benchmarks. While some strategies to improve purchase frequency or spending exist, they lack consistency or long-term planning.
Deep understanding (+1, +2, +3): Green Clean uses customer data to track ARPU effectively. The brand encourages frequent purchases through a subscription model and increases average spend with bundle offers. Historical ARPU trends show steady growth, and future projections align with the company’s sustainability goals.
Conclusion
The ARPU sub-dimension is critical for understanding and optimizing revenue per user. By accurately measuring ARPU, analyzing trends, and implementing strategies to improve frequency and spending, businesses can drive growth and ensure long-term success. Aligning ARPU with sustainability principles further reinforces customer loyalty and brand integrity.
Sources
Definition, Investopedia, https://www.investopedia.com/terms/a/average-revenue-user-arpu.asp
HUBSPOT, ARPU: How to Calculate and Interpret Average Revenue Per User, https://blog.hubspot.com/service/arpu
More on the Marketing Canvas

Marketing Canvas - Acquisition
This article dives deep into the intricacies of Customer Acquisition, a critical aspect of any marketing strategy. It defines key performance indicators - Customer Acquisition Rate (CAR) and Cost of Customer Acquisition (COCA or CAC), and elucidates their relevance and calculation methods. The importance of measuring these metrics is brought to life using practical examples and industry insights. The piece further delves into the arsenal of tools available for customer acquisition, and how these can be effectively harnessed to drive growth. From there, we outline how to turn acquisition strategies into action, evaluate their performance, and make necessary improvements. Through the lens of a real-world 'Green Clean' use case, we demonstrate the practical application of these principles. An essential read for entrepreneurs and marketers aspiring to master the art of customer acquisition.
Last update: 15/06/2023
In a nutshell
This article dives deep into the intricacies of Customer Acquisition, a critical aspect of any marketing strategy. It defines key performance indicators - Customer Acquisition Rate (CAR) and Cost of Customer Acquisition (COCA or CAC), and elucidates their relevance and calculation methods. The importance of measuring these metrics is brought to life using practical examples and industry insights. The piece further delves into the arsenal of tools available for customer acquisition, and how these can be effectively harnessed to drive growth. From there, we outline how to turn acquisition strategies into action, evaluate their performance, and make necessary improvements. Through the lens of a real-world 'Green Clean' use case, we demonstrate the practical application of these principles. An essential read for entrepreneurs and marketers aspiring to master the art of customer acquisition.
In the Marketing Canvas
The Marketing Canvas is a powerful tool for entrepreneurs and non-marketers to build a robust marketing strategy. It consists of six meta-dimensions, each with four sub-dimensions, for a total of 24 sub-dimensions defining your Marketing Strategy. One of these sub-dimensions is ACQUISITION, which falls under the METRICS meta-category.
Defining ACQUISITION
Every successful venture has customer acquisition as its cornerstone metric. The reality is, regardless of how innovative or unique your product or service may be, its relevance is directly proportional to the number of users it attracts and retains. Hence, we will delve deeper into the concept of Acquisition, one of the sub-dimensions of the Marketing Canvas, in this chapter.
Acquisition, as it pertains to marketing, refers to the process of attracting and converting potential consumers into actual customers. A healthy business is characterized not just by acquiring more users but also transitioning them into paid customers, thereby increasing revenue and profitability. It's worth mentioning that the current 'Growth Hacking' trend has reinforced the emphasis on acquisition strategies.

Measurement of Customer Acquisition occurs via two key performance indicators (KPIs):
Customer Acquisition Rate (CAR): This is the ratio of the number of customers acquired to the length of the time period.
Cost of Customer Acquisition (CAC): This represents the total expenditure on marketing efforts divided by the number of customers acquired during that period.
Both CAR and CAC play crucial roles in comprehending the speed at which you're gaining new customers and the investment required to achieve this. According to marketing guru Neil Patel, CAC signifies the cost involved in convincing a potential customer to purchase a product or service. Comparing your CAC per media to industry standards and competitors will provide an insight into your performance.
If your CAR falls below your competitors, it implies a slower customer acquisition rate. Although this isn't a cause for immediate alarm, considering other dimensions like Average Revenue Per User (ARPU) will help understand if it is a serious issue or not.
Some may argue that these metrics are only applicable to service businesses, not products. However, the underlying philosophy of the Marketing Canvas is to thoroughly understand your customers, be it a product or service. If your business relies on indirect distribution and lacks customer data, it might hinder personalizing your offerings. Inability to measure CAR and CAC due to a lack of direct customer interaction is a stumbling block in the application of the Marketing Canvas Method.

Tools for ACQUISITION
Effective acquisition isn't a matter of luck or chance; it's the result of strategically leveraging an array of tools and techniques. Here are a few tools that can significantly improve your acquisition metrics:
SEO Tools: Platforms like Moz, SEMrush, and Google's Keyword Planner can help you optimize your online presence and improve organic traffic, leading to higher acquisition.
Content Marketing Tools: Tools like HubSpot, WordPress, and Grammarly can assist in creating compelling content that drives customer interest and engagement.
Social Media Advertising: Platforms like Facebook Ads Manager and LinkedIn Campaign Manager can help you reach a wider audience and target potential customers more effectively.
Email Marketing: Tools like Mailchimp or ConvertKit can help you build and maintain relationships with potential customers, fostering trust and improving acquisition rates.
Translating Acquisition into Action
Once you've mastered the principles and tools of acquisition, it's time to put this knowledge into practice.
Set Clear Goals: Begin by identifying specific, measurable, achievable, relevant, and time-bound (SMART) goals for your acquisition efforts.
Identify Your Audience: Understand your potential customers, their needs, and their preferences.
Optimize Your Channels: Improve your visibility on all the platforms your target audience frequents.
Test, Measure, Refine: Regularly review your CAR and CAC metrics, identify areas of improvement, and refine your strategy accordingly.
Statements for self-assessment
Is the Acquisition of new users helping you achieve your goals?
Evaluation is the pillar on which successful businesses are built. Regular monitoring and reassessment are essential to improving your acquisition strategy. To evaluate your acquisition efforts, consider the following statements, rating your agreement from -3 (completely disagree) to +3 (completely agree):
Your Customer Acquisition Cost (CAC) is below industry average and is below your direct competitors.
Your conversion rate (from lead to buyer) is above industry average and is above your direct competitors.
Your CLTV/CAC is above industry average with a ratio above 3:1 and below 5:1
Your time to conversion rate (from lead to buyer) is above industry average and is above your direct competitors.
Interpretation of the scores
Negative scores (-1 to -3): Suggest inefficiencies in your acquisition strategy. CAC may be high, conversion rates low, and CLTV/CAC ratios misaligned, indicating missed opportunities for improvement.
A score of zero (0): Reflects a functional but unoptimized strategy. While some metrics may meet industry benchmarks, there are gaps preventing full efficiency and profitability.
Positive scores (+1 to +3): Indicate an effective acquisition strategy with competitive CAC, high conversion rates, a healthy CLTV/CAC ratio, and short time-to-conversion periods.
Case study: Green Clean’s Acquisition strategy
Misaligned understanding (-3, -2, -1): Green Clean’s CAC is significantly higher than competitors, with low conversion rates and a CLTV/CAC ratio below 3:1. The time to conversion is long, indicating inefficiencies in the sales funnel.
Surface understanding (0): Green Clean’s CAC and conversion rates are in line with industry averages but lack optimization. The CLTV/CAC ratio is acceptable but not optimized for long-term growth. Time to conversion is adequate but could be reduced with better targeting.
Deep understanding (+1, +2, +3): Green Clean optimizes CAC by focusing on high-performing channels and using automation. Conversion rates are improved through a streamlined funnel and personalized engagement. The CLTV/CAC ratio exceeds 4:1, and time to conversion is reduced through quick onboarding and targeted offers.
Conclusion
The Acquisition sub-dimension highlights the importance of optimizing CAC, conversion rates, CLTV/CAC ratios, and time to conversion for sustainable growth. A well-executed acquisition strategy ensures that your business attracts the right customers, maximizes profitability, and remains competitive in the market.
Sources
Neil Patel, Customer Acquisition Cost, https://neilpatel.com/blog/customer-acquisition-cost/
More on the Marketing Canvas

Marketing Canvas - Influencers
People are trusting People. Influencer marketing campaigns can help reach a more targeted audience, thus leading to more impactful results. In your Marketing Strategy, you should definitely consider influencer marketing and define whether or not if it could help you achieve your goals.
Last update: 1 January 2021
In a nutshell
In today's digital landscape, influencers play a significant role in shaping consumer perceptions and buying decisions. This comprehensive guide dives into the world of influencer marketing, discussing different types of influencers and their potential impact on your marketing strategy. It examines how influencers fit into the Marketing Canvas, a framework for conceptualizing and structuring your marketing strategy. Practical examples are provided to illustrate the potential of effective influencer collaborations. Furthermore, the guide highlights essential tools for influencer management and ways to translate influencer activities into tangible actions. The guide concludes with an emphasis on the need for continuous evaluation and improvement of your influencer strategy, providing a robust assessment framework and practical tips for scoring and improvement. The information in this guide is indispensable for marketers seeking to harness the power of influencers in their marketing strategy.
In the Marketing Canvas
The Marketing Canvas is a powerful tool for entrepreneurs and non-marketers to build a robust marketing strategy. It consists of six meta-dimensions, each with four sub-dimensions, for a total of 24 sub-dimensions defining your Marketing Strategy. One of these sub-dimensions is INFLUENCERS, which falls under the CONVERSATION meta-category
Defining Influencers
In the vast and evolving landscape of digital marketing, the role of influencers has grown exponentially. These influencers span various types, each with unique attributes and reach. According to Hubspot[1], there are five different types of influencers:
Micro-influencer: With a modest following ranging from thousands to tens of thousands, micro-influencers can have a profound impact within their specific niche. They have developed trust and rapport with their followers, making them highly effective in influencing their followers' decisions.
Celebrity influencer: With enormous followings usually in the millions, celebrity influencers are famous individuals known across many industries. They have the power to influence people through their fame and high public visibility.
Blog influencer: Blog influencers have a loyal readership that subscribes to their content. They are skilled in crafting narratives that can engage, inform, and influence their readership.
Social media influencer: These influencers have significant recognition across social media platforms such as Instagram, YouTube, Facebook, or Twitter. They interact with their followers directly and shape opinions and trends.
Key opinion leader: KOLs are high-level experts on specialized topics within a particular field. They have in-depth knowledge and expertise, making their opinions highly respected and influential.
Hubspot[1] is defining influencers (also brand influencers) as:
A brand influencer refers to someone who has a following within a specific niche that they engage with regularly. Because of this, they have the power to impact their purchase decisions. The major types of brand influencers include micro-influencer, celebrity influencer, blog influencer, social media influencer, and key opinion leader (each of which we’ll define momentarily).
Introducing the Influencers dimension to the Marketing Canvas was a deliberative decision. While it's easy to group influencers under the Media umbrella, such an approach could underestimate their unique roles and significance in shaping public opinion and influencing consumer behaviors.
A brand influencer is a person who commands a following within a particular niche and engages with them frequently. This relationship allows them to exert considerable influence on their followers' purchase decisions.
In an era where people's trust in brands is increasingly mediated through personal relationships, influencers play a crucial role. They create user-generated content (UGC), a key form of communication thanks to social media and digital publishing tools.
Influencer marketing, therefore, becomes a critical dimension of a business's marketing strategy. It's not just about establishing a specific influencer strategy, but recognizing the important role influencers play within your overall marketing strategy.
To realize the potential benefits of influencer marketing, businesses need to evaluate if and how an Influencer Strategy aligns with their brand purpose, customer profiles, and value proposition.
Examples of successful influencer strategies include Gleam's Electric Adventures campaign for EDF Energy, which reached over 1 million people in the UK through 59 pieces of unique content, and Dell Technologies' influencer-hosted podcast, which fostered strong relationships with industry influencers.
Tools for Influencers
Identifying and engaging with the right influencers necessitates the use of specialized tools. These tools help you discover influencers, manage relationships, track metrics, and more. Examples of such tools include:
BuzzSumo: This tool helps businesses find influencers related to specific topics or industries. It also tracks your brand's mentions and engagement across various social media platforms.
Hootsuite: Beyond its well-known scheduling capabilities, Hootsuite can assist in identifying influencers by monitoring mentions and hashtags related to your brand or industry.
Traackr: This is an influencer relationship management tool that helps you manage and track your engagement with influencers.
Translating Influencers into Action
Influencer marketing is more than just gaining visibility—it's about translating that visibility into actionable results. To do this, consider the following steps:
Set Clear Goals: Establish what you want to achieve through the influencer partnership. This could be increased brand awareness, lead generation, or direct sales.
Collaborate on Content: Work with the influencer to develop content that aligns with your brand values and message, but also resonates with the influencer's audience.
Track Metrics: Monitor the performance of your influencer marketing campaigns, tracking metrics like engagement rate, click-through rate, conversions, etc.
Adjust Strategy: Based on the metrics and feedback, adjust your influencer strategy as needed.
Examples
Gleam created Electric Adventures – a standout consumer-focused social media video series that enabled personal stories to be brought to life whilst busting the common myths around electric vehicles and maintaining EDF Energy’s reputation. The campaign created far more in-depth brand engagement than a 30-second TV advert could achieve, reaching more than 1 million people in the UK via 59 pieces of content (source: 2020, https://influencermarketingawards.com/winners/).

Dell Technologies launched a podcast hosted by influencers featuring conversations with technology visionaries. The interesting thing about this program is that Dell is able to develop strong relationships with industry influencers. (source: https://artplusmarketing.com/5-b2b-influencer-marketing-strategies-you-should-try-149e369fd4ae).
Statements for self-assessment
Are your INFLUENCERS helping you achieve your goals?
Evaluating your influencer strategy helps you understand its effectiveness in achieving your marketing goals. Consider the following statements, rating your agreement on a scale from -3 (completely disagree) to +3 (completely agree):
You are working with influencers that match your brand purpose and are your brand ambassadors.
You have defined clear and actionable goals for your influencer strategy aligned with your marketing strategy goals.
You let your influencers develop content that tells a story for their audience in their voice while highlighting your brand.
You have set long term metrics for your influencers, preferably annual ROI target in brand image and community engagement.
You are working with influencers showcasing a sustainable behavior and you are optimizing the sustainability impact of your influencer strategy
Interpretation of the scores
Negative scores (-1 to -3): Indicate misalignment or ineffectiveness in your influencer strategy. Influencers may not represent your brand purpose, and your goals, content, or sustainability efforts may be unclear or poorly executed.
A score of zero (0): Reflects partial effectiveness. While some aspects of your influencer strategy are functional, others require improvement to maximize impact and alignment with your brand purpose.
Positive scores (+1 to +3): Suggest a well-rounded and effective influencer strategy. Your partnerships align with your brand’s purpose, deliver meaningful content, and prioritize sustainability, driving long-term engagement and ROI.
Case study: Green Clean’s Influencer strategy
Misaligned understanding (-3, -2, -1): Green Clean collaborates with influencers who lack alignment with its sustainability mission. Campaigns are disjointed, with no clear goals or metrics, resulting in low engagement and limited brand impact.
Surface understanding (0): Green Clean partners with influencers who share its values but fails to set clear objectives or provide creative freedom. As a result, campaigns generate moderate traction but lack authenticity and measurable outcomes.
Deep understanding (+1, +2, +3): Green Clean partners with eco-conscious influencers who embody its mission. Campaigns include compelling stories about sustainable living, measurable goals for engagement and brand awareness, and a strong focus on reducing environmental impact.
Conclusion
The Influencers sub-dimension underscores the importance of thoughtful collaboration with individuals who align with your brand’s purpose and sustainability goals. By setting clear objectives, empowering authentic storytelling, and measuring long-term impact, your influencer strategy can drive meaningful engagement and reinforce your brand’s values.
Sources
Hubspot, 2019, Ultimate Guide to Influencer Marketing, https://blog.hubspot.com/marketing/how-to-work-with-influencers
Adweek, 2018, http://www.adnews.com.au/news/people-trust-people-but-they-don-t-necessarily-trust-brands
SproutSocial, Influencer Marketing, https://sproutsocial.com/insights/influencer-marketing/
Harvard Business Review, 2019, https://hbr.org/2019/04/how-brands-can-build-successful-relationships-with-influencers
More on the Marketing Canvas

Marketing Canvas - Media
This comprehensive guide delves deep into the role of media in marketing, helping entrepreneurs and marketers, novice or experienced, understand the subtleties of different media channels and how they can be leveraged for success. We explore Owned, Earned, Shared, and Paid media, providing examples and practical tips for each. This guide also outlines how to translate these theories into effective actions and offers a scoring system for evaluating your current media strategy. It covers potential reasons behind scores and offers insights for strategic improvement. The article concludes with a case study from Green Clean to illustrate how a well-executed media strategy can propel a business forward. This guide serves as an essential read for anyone looking to harness the power of media in their marketing strategy.
Last update: 15/6/2023
In a nutshell
This comprehensive guide delves deep into the role of media in marketing, helping entrepreneurs and marketers, novice or experienced, understand the subtleties of different media channels and how they can be leveraged for success. We explore Owned, Earned, Shared, and Paid media, providing examples and practical tips for each. This guide also outlines how to translate these theories into effective actions and offers a scoring system for evaluating your current media strategy. It covers potential reasons behind scores and offers insights for strategic improvement. The article concludes with a case study from Green Clean to illustrate how a well-executed media strategy can propel a business forward. This guide serves as an essential read for anyone looking to harness the power of media in their marketing strategy.
In the Marketing Canvas
The Marketing Canvas is a powerful tool for entrepreneurs and non-marketers to build a robust marketing strategy. It consists of six meta-dimensions, each with four sub-dimensions, for a total of 24 sub-dimensions defining your Marketing Strategy. One of these sub-dimensions is MEDIA, which falls under the CONVERSATION meta-category
Defining Media
In any given relationship, communication is vital. The same is true for your business, where the exchange of messages is constant between you and your audience—your prospects, clients, customers. You initiate conversations using your stories and content. But where do these discussions take place? This leads us to a rather colossal industry that encapsulated $629 billion in 2018: media advertising.
A look into the past reveals how companies carpet-bombed potential and existing clients with advertising—a unidirectional monologue that is now more commonly referred to as "Push Communication." As times evolved and technology advanced, the internet and digital marketing gave birth to a more targeted and pertinent approach, transiting towards a pull mechanism.
In today's world, you could adopt a minimalistic approach requiring almost no budget, or you could choose a more sophisticated and expensive strategy. Your media strategy depends entirely on your business's scale, budget, audience, and objectives.
PESO model from Spinsucks (credentials: https://spinsucks.com/communication/peso-model-breakdown/)
To comprehend this vast landscape, we employ the PESO model. As a business, you already possess some media assets—your website, an email database of your clients or visitors, business cards collected during events, and more. This is your Owned Media. You don't need to shell out extra money to publish content on these channels. This is an excellent start for any business, particularly startups or SMEs.
The second type is Earned Media. Earned media refers to publicity or media relations. It's when you secure a mention in a newspaper or a trade publication, or you make an appearance on a news show to discuss your product. This has been the traditional domain of PR.
Shared Media, also known as social media, is the next facet. It has evolved beyond just marketing or customer service, becoming a primary means of communication both internally and externally for many businesses.
Finally, we have Paid Media. These are channels that you pay for to distribute your content. It could be mass media like TV, billboards, newspapers (also known as above the line), or direct marketing media like mailing lists (referred to as below the line media). Social media platforms such as Facebook also offer paid advertising options.
Your media strategy should be in alignment with your customers, your purpose, and the touchpoints of your journey. An imbalance in your efforts across these four media types, or a lack of alignment of your media strategy with your customers and goals, can compromise the effectiveness of your campaign.
Tools for Media
In the constantly evolving digital era, having the right set of tools is key to managing and optimizing your media presence. Here, we delve into some of the tools essential for each type of media.
For Owned Media, a CMS (Content Management System) like WordPress or Squarespace is necessary to manage your website. Email marketing software such as MailChimp or Constant Contact can assist with email campaigns.
For Earned Media, consider tools like HARO (Help a Reporter Out) to connect with journalists looking for expert quotes or BuzzSumo to analyze which content performs best.
For Shared Media, social media management tools like Hootsuite or Buffer can help manage and schedule posts. Social listening tools such as Sprout Social or Brandwatch can monitor mentions of your brand across various platforms.
For Paid Media, platforms like Google Ads or Facebook Business Manager can help with ad creation and tracking. Tools like SEMrush or SpyFu can provide insights into your competitors' ad strategies.
Each of these tools helps manage different aspects of your media strategy, making your campaigns more effective and efficient.
Translating Media into Action
The effective usage of the media mix is not an end in itself. It's about converting that usage into concrete actions – which ultimately results in achieving your organizational goals.
Firstly, Owned Media, if used effectively, can create a strong brand identity and serve as a reliable information source about your products or services. An action point here is to optimize your website and other owned media to convert visitors into leads or sales.
For Earned Media, the goal is often to build credibility. Positive press mentions can be leveraged to foster trust among your audience. The resultant action would be to convert this trust into customer loyalty and advocacy.
In Shared Media, the action can be twofold. Firstly, it can serve to foster a community around your brand, driving engagement through shares, likes, and comments. Secondly, it can be used to provide customer service, addressing concerns and queries in real-time.
Lastly, Paid Media can drive a variety of actions, from awareness to conversions. The key here is to design the creative and copy in a way that resonates with your target audience and prompts them to take the desired action.
Statements for self-assessment
Is the current Media strategy helping you achieve your goals?
To understand whether your Media strategy is helping you achieve your goals, comprehensive evaluation is critical. Rate your agreement with the following statements on a scale from -3 (completely disagree) to +3 (completely agree):
Your owned media are solid, consistent with your goals and serve as the foundation for your media strategy.
Your earned media strategy helps you to secure authority and credibility of your business to your audience.
You have created engagement and community for your customers through your shared media strategy.
You have amplified your targeting for achieving your goals through paid off-line and on-line media.
Your media strategy is compatible with the concept of sustainability
This scoring system will help you identify areas where your strategy is strong, as well as areas for improvement. For instance, a low score in the earned media strategy may indicate a need for stronger PR efforts.
Remember, media strategy is a dynamic process that requires constant refinement. Regularly evaluating your strategy and making necessary improvements can lead to better alignment with your business objectives, ultimately improving your return on investment.
Interpretation of the scores
Negative scores (-1 to -3): These scores suggest significant gaps in your media strategy. Your owned media may lack consistency, your earned media efforts may fail to build credibility, and your shared or paid media may not engage customers effectively or align with sustainability.
A score of zero (0): A neutral score indicates partial effectiveness. While some media aspects may work, others are underdeveloped, limiting the overall impact of your strategy.
Positive scores (+1 to +3): Positive scores suggest a well-rounded and effective media strategy. Your owned, earned, shared, and paid media are aligned with your goals and sustainability principles, creating a cohesive and impactful presence.
Case study: Green Clean’s Media strategy
Misaligned Understanding (-3, -2, -1): Green Clean’s owned media (e.g., website) lacks regular updates and optimization. Earned media efforts are sporadic, and shared media fails to engage customers meaningfully. Paid campaigns are generic and do not target specific audience segments effectively.
Surface Understanding (0): Green Clean has a functional website and earns occasional media coverage but lacks a cohesive strategy. Shared media posts generate limited engagement, and paid campaigns are not optimized for ROI or sustainability.
Deep Understanding (+1, +2, +3): Green Clean uses a regularly updated, sustainability-focused website as the cornerstone of its strategy. Earned media features testimonials from eco-conscious influencers, while shared media fosters a community through engaging posts about reducing waste. Paid campaigns use targeted ads promoting green initiatives, all while minimizing environmental impact.
Conclusion
The Media sub-dimension ensures that your marketing efforts are strategically aligned across owned, earned, shared, and paid channels. By focusing on integration, engagement, and sustainability, you can amplify your brand's reach, credibility, and impact, fostering stronger connections with your audience and supporting your business goals.
Sources
PESO Marketing Model, https://iterativemarketing.net/peso-model-marketing/
Spinsucks.com, https://spinsucks.com/communication/peso-model-breakdown/
More on the Marketing Canvas

Marketing Canvas - Content and Stories
This article offers an extensive guide on how to harness the power of content and stories in your marketing strategy, following the renowned Marketing Canvas framework by Laurent Bouty. From understanding the significance of content in attracting and retaining customers, to choosing the right tools, and translating your content into actions - the article comprehensively covers it all. It further discusses how to evaluate and continuously improve your content and stories, ensuring they reflect your organization's goals and meet users' needs. Lastly, the article provides a practical use-case example to illustrate the application of these concepts. Whether you're a non-marketer, an entrepreneur, or a marketer seeking fresh insights, this article offers valuable knowledge and actionable strategies to elevate your marketing efforts.
Last update: 15/6/2023
In a nutshell
The Content & Stories sub-dimension in the Marketing Canvas emphasizes the importance of crafting compelling narratives that reflect your organization’s goals, resonate with your audience, and inspire action. Effective content and stories are built on a deep understanding of how users think and speak about a subject, leveraging appropriate mediums to maximize impact. Furthermore, these stories should be truthful, align with sustainability principles, and contribute to building trust with your audience.
For example, Green Clean might tell stories of families creating healthier homes by choosing eco-friendly products, illustrating both the emotional and practical benefits of sustainability.
Introduction
The Content & Stories sub-dimension within the Conversation category focuses on how organizations communicate with their audience. Stories and content are powerful tools for sharing your brand’s purpose, values, and solutions. To be impactful, they must address user needs, convey clear messages, and inspire desired actions while remaining authentic and aligned with sustainability.
Content and storytelling are not just about information—they are about connection, inspiring loyalty, and reinforcing your brand's relevance.
What are Content & Stories?
Content and stories are integral components of a successful marketing strategy. They represent how your brand communicates value, connects with its audience, and inspires action. Content marketing takes a strategic approach to creating and distributing valuable, relevant, and consistent content to attract and engage a clearly defined audience. Its ultimate goal? To drive profitable customer actions.
"Content marketing is a strategic marketing approach focused on creating and distributing valuable, relevant, and consistent content to attract and retain a clearly defined audience — and, ultimately, to drive profitable customer action."
The true power of content and stories lies in their ability to act as catalysts within your Marketing Strategy. Reflecting on the concept of inbound marketing, the idea of engaging with suspects, prospects, or customers through an ongoing, positive dialogue immediately resonated with me. By designing thoughtful inbound funnels, we can craft compelling stories and create meaningful content that adds value and aligns with customer needs.
Creating impactful content requires more than just originality. Beyond producing your own content, alternative approaches include:
Curating: Sharing content from trusted sources that align with your brand values.
Co-creating: Collaborating with others to produce content that reflects your shared vision.
A quote from the CMO of General Electric encapsulates the essence of effective content:
"Content that tries to sell, doesn’t! Content that tries to help, does!"
Your content should resonate with your Purpose, align with your customers' Job-to-Be-Done and Aspirations, and consistently reflect your Value Proposition. Most importantly, it must integrate seamlessly into your funnels and customer Journey.

Marketing Canvas by Laurent Bouty - Stories
The role of storytelling
Storytelling elevates content by weaving narratives that captivate and resonate with your audience. It’s an age-old art that combines facts with engaging delivery to communicate a message effectively. Stories can be grounded in reality or creatively enhanced to emphasize core messages.
What makes a good story? According to HubSpot, great stories share these qualities:
Entertaining: They capture and hold attention.
Educational: They provide value and new insights.
Universal: They appeal to diverse audiences.
Well-Organized: They follow a clear, logical structure.
Memorable: They leave a lasting impression.
A strong story keeps readers engaged, ignites curiosity, and establishes an emotional connection. For example, Green Clean could share a customer’s journey toward sustainable living, highlighting how their products played a transformative role.
Aligning Content and Stories with strategy
For content and storytelling to be effective, they must align with your audience’s needs and aspirations. A fragmented or irrelevant strategy will fail to resonate and drive action. When aligned, content and stories:
Reflect your brand’s Purpose and connect to your audience’s identity.
Address the Journey by mapping to critical moments.
Reinforce your Value Proposition with relevance and authenticity.
The power of stories and content lies in their ability to make your brand unforgettable, fostering loyalty and driving sustainable growth.
Content & Stories: an in-depth perspective
To create effective content and stories, businesses must:
Align goals with needs: Ensure that storytelling serves both organizational objectives and user expectations, striking a balance between informing and inspiring.
Adopt a user-centric approach: Understand how your audience thinks and communicates to ensure your stories resonate authentically.
Include clear CTAs: Guide users toward meaningful actions that align with your goals, such as making a purchase or signing up for a newsletter.
Optimize medium selection: Choose the right channel or format to maximize the story’s impact, considering both the audience and resource constraints.
Communicate sustainability: Use truthful, engaging content to share your sustainability efforts without exaggeration or greenwashing.
For example:
User-centric: Green Clean’s content addresses common questions about eco-friendly cleaning, reflecting customer concerns and language.
Sustainability focus: The brand publishes blog articles about reducing plastic waste through refillable packaging.
Translating Content & Stories into action
Content and stories should seamlessly connect organizational goals with customer expectations. To achieve this:
Plan strategically: Ensure all content aligns with both business objectives and audience aspirations.
Engage authentically: Use user-friendly language and relatable narratives.
Inspire action: Include clear, actionable CTAs to guide customers effectively.
Leverage the right channels: Adapt your content to the medium that maximizes impact.
Maintain transparency: Build trust through truthful storytelling, especially around sustainability.
Questions to consider:
Do your content and stories reflect both your organization’s goals and your users’ needs?
Are your content and stories structured based on how your audience thinks and speaks?
Do your stories include clear and actionable CTAs?
Have you chosen the right medium for your content, balancing impact with resource constraints?
Are your stories truthful and aligned with sustainability principles?
Statements for self-assessment
For a comprehensive evaluation of your understanding and application of the Content & Stories concept, rate your agreement with the following statements on a scale from -3 (completely disagree) to +3 (completely agree):
Your content and stories goals are reflecting your organisation's goals and user's needs.
Your content and stories are created and structured based on your understanding of how users think and speak about a subject.
Your content and stories have clear calls to action. You know exactly what you want your users to do after reading.
You have chosen your content and stories medium adequately in function of your type of story as well as resources, like time and money.
Your content and stories are truthful and communicate about sustainability.
Interpretation of the scores
Negative scores (-1 to -3): Negative scores indicate that your content and stories are disconnected from your goals, fail to meet user needs, or lack clarity and credibility. These issues can lead to disengagement, confusion, and mistrust. Immediate action is needed to realign your storytelling with audience expectations and organizational values.
A score of zero (0): A neutral score reflects partial alignment of your content and storytelling efforts with user needs and organizational goals. While some aspects may be effective, gaps remain in structure, messaging, or authenticity. Additional effort is required to refine your approach and ensure consistent impact.
Positive scores (+1 to +3): Positive scores suggest that your content and stories are well-aligned with organizational goals, user needs, and sustainability principles. They are structured effectively, include clear CTAs, and leverage the right mediums to maximize engagement and impact.
Case study: Green Clean’s Content & Stories
Misaligned understanding (-3, -2, -1): Green Clean’s content is generic and fails to connect with its audience. The brand uses overly technical language that alienates users and lacks clear CTAs, making it unclear what actions customers should take after engaging with the content.
Surface understanding (0): Green Clean’s content addresses some user needs but lacks consistency and focus. For example, while blog articles discuss sustainability, the storytelling is not user-centric, and calls to action are vague or absent, limiting engagement.
Deep understanding (+1, +2, +3): Green Clean creates compelling content that reflects user concerns about sustainability and provides actionable insights. Stories about families using eco-friendly cleaning solutions are shared through engaging videos on social media, with clear CTAs to subscribe to the brand’s services. The content is authentic, transparent, and highlights the brand’s commitment to sustainability.
Conclusion
The Content & Stories sub-dimension is vital for crafting narratives that connect with your audience, inspire action, and reinforce your brand’s values. By aligning storytelling with organizational goals, user needs, and sustainability principles, businesses can create impactful content that fosters trust, loyalty, and engagement.
Sources
Download first chapter of ebook on content here
Download ebook on content: https://qualifio.com/blog/en/content-marketing-professional-practical-guide/
Ultimate guide of storytelling (Hubspot), https://blog.hubspot.com/marketing/storytelling
More on the Marketing Canvas
Originally published August 2019, updated December 2020

Marketing Canvas - Listening to
In today's digitally connected world, the importance of listening to customers has never been more paramount. This comprehensive guide dives deep into the process of establishing an effective Voice of Customer (VoC) system. It lays the groundwork for understanding why listening is crucial, how to listen effectively, and how to translate customer feedback into actionable insights. The guide also offers tips for choosing the right tools for the task, provides a step-by-step assessment for evaluating your listening methods, and even includes a real-world case study to demonstrate these principles in action. In a world where customer satisfaction drives business success, this guide will arm you with the knowledge you need to ensure that your customers always feel heard.
Last update: 06/12/2024
In a nutshell
The Listening To sub-dimension in the Marketing Canvas focuses on the systematic collection and analysis of customer voices (Voice of Customer, or VOC) to understand their perceptions, needs, and expectations. By implementing a robust VOC system, businesses can ensure they listen to what customers are saying about their brand and value proposition, enabling data-driven decisions and continuous improvement. This includes capturing customer feedback on sustainability, an increasingly critical aspect of modern business.
For example, Green Clean may use surveys, social media monitoring, and feedback forms to collect customer insights, helping refine its eco-friendly cleaning products and sustainability messaging.
Introduction
The Listening To sub-dimension within the Conversation category is about actively capturing and analyzing customer feedback to better understand their experiences and expectations. A strong VOC system ensures that businesses make decisions based on real customer data rather than assumptions, aligning their strategies with customer needs and preferences.
Listening effectively to customers enables brands to:
Build trust by showing customers their voices are heard.
Improve the customer journey by addressing pain points and unmet needs.
Strengthen their sustainability commitments by understanding customer expectations in this area.
What is Listening To?
Listening To involves the systematic capture, analysis, and application of customer feedback. Key elements include:
Comprehensive VOC System: Tools and processes to gather customer feedback across multiple channels.
Data-Driven Insights: Decisions based on accurate and objective data rather than assumptions.
Journey and Lifecycle Understanding: VOC systems tailored to specific points in the customer journey and lifecycle.
Multi-Technique Approach: Combining methods such as surveys, interviews, social media monitoring, and analytics.
Sustainability Insights: Capturing feedback on customer views regarding environmental and social responsibility.
For example:
Green Clean might use a survey to understand customer satisfaction with its eco-friendly packaging while also analyzing social media for sentiment around its sustainability claims.
“Listening to the needs of your customers isn’t an optional exercise; it’s mandatory. Even if you don’t intend to differentiate on customer experience (and you’re in a small minority if so), the value of listening to customers is real, measurable, and immediate.” CMO.com

Listening To: an in-depth perspective
To create an effective VOC process, businesses must:
Establish a VOC System: Implement systems to capture customer feedback across all relevant touchpoints.
Leverage Data-Driven Processes: Use advanced analytics to eliminate assumptions and focus on actionable insights.
Understand the Customer Journey: Tailor feedback mechanisms to reflect the unique needs and touchpoints of the customer lifecycle.
Combine Techniques: Use a mix of qualitative and quantitative research methods for a comprehensive understanding.
Focus on Sustainability: Ensure that customer feedback includes views on sustainability, a key driver of modern consumer behavior.
For instance:
Green Clean could use feedback forms at checkout, analyze product reviews for sustainability comments, and track brand mentions on social media to capture a holistic view of customer perceptions.
Translating listening to into action
To listen effectively to customers, businesses need a structured and consistent approach:
Design Your VOC System: Identify key touchpoints and feedback mechanisms across the customer journey.
Implement Data Analytics: Ensure your VOC process is data-driven and includes tools to analyze qualitative and quantitative feedback.
Integrate Sustainability: Include questions and feedback opportunities focused on environmental and social impact.
Questions to consider:
Have you set up a comprehensive VOC system to capture customer feedback across multiple channels?
Is your VOC process entirely data-driven, avoiding assumptions at every stage?
Does your VOC system reflect an in-depth understanding of the customer journey and lifecycle?
Are you using a variety of techniques to gather and validate customer feedback?
Does your VOC system capture your customers’ views on sustainability effectively?
But listening is not the same as understanding. How you listen, and to whom you listen, is critical. Even a smart, high-end business can be led astray by misunderstanding the strengths and weaknesses of different customer feedback channels. HBR[2]
Statements for self-assessment
For a comprehensive evaluation of your understanding and application of the Listening To concept, rate your agreement with the following statements on a scale from -3 (completely disagree) to +3 (completely agree):
You have set a VOC system that captures everything that customers are saying about your brand and your value proposition.
Your entire VOC process is data-driven, and at no point are you making any assumptions.
Your VOC process is based on an in-depth knowledge of your user's journey and customer lifecycle.
You are using a few different techniques together to ensure you're getting the most that you can from your research.
Your VOC system captures your customers' views on sustainability.
Interpretation of the scores
Negative scores (-1 to -3): Negative scores indicate significant gaps in your VOC process, such as a lack of data-driven decision-making, insufficient understanding of the customer journey, or a failure to address sustainability. These shortcomings may result in missed opportunities to align with customer expectations and improve brand perception. Immediate action is needed to develop a structured VOC approach.
A score of zero (0): A neutral score reflects partial implementation or limited effectiveness of your VOC system. While some processes may exist, they are not comprehensive or data-driven enough to provide actionable insights. Additional effort is needed to refine your VOC strategy and incorporate sustainability feedback.
Positive scores (+1 to +3): Positive scores suggest that your VOC system is robust, comprehensive, and data-driven. It effectively captures feedback at all relevant touchpoints, aligns with the customer journey, and includes insights on sustainability. This ensures you are well-equipped to adapt to customer needs, improve experiences, and strengthen brand loyalty.
Case study: Green Clean’s VOC system
Misaligned understanding (-3, -2, -1): Green Clean lacks a structured VOC system, relying on anecdotal feedback or assumptions. The brand misses key insights into customer needs, such as the demand for more refill options, and fails to capture sustainability-related feedback, weakening its eco-friendly positioning.
Surface understanding (0): Green Clean has implemented some feedback mechanisms, such as a customer satisfaction survey, but these are not integrated into a comprehensive VOC system. The feedback collected is limited in scope, failing to address the full customer journey or provide meaningful insights into sustainability.
Deep understanding (+1, +2, +3): Green Clean has a robust VOC system that captures feedback across multiple channels, including surveys, product reviews, and social media. The system is fully data-driven, with advanced analytics identifying trends and customer pain points. Sustainability feedback is a core component, helping the brand continuously refine its eco-friendly initiatives.
Conclusion
The Listening To sub-dimension is essential for understanding and responding to customer needs, preferences, and expectations. A comprehensive, data-driven VOC system that integrates sustainability insights enables businesses to make informed decisions, enhance the customer journey, and strengthen brand loyalty. By actively listening to customers, brands can stay ahead of the curve and build lasting relationships.
Sources
Hubspot, 12 Voice of the Customer Methodologies To Generate a Goldmine of Customer Feedback, https://blog.hubspot.com/service/voice-of-the-customer-methodologies
Harvard Business Review, 2015, Everyone Says They Listen to Their Customers—Here’s How to Really Do It, https://hbr.org/2015/10/everyone-says-they-listen-to-their-customers-heres-how-to-really-do-it
McKinsey, Are you really listening to what your customers are saying?, https://www.mckinsey.com/business-functions/operations/our-insights/are-you-really-listening-to-what-your-customers-are-saying
Futurelab, Your VoC Programme is underperforming - and you know it, https://www.futurelab.net/slide/your-voc-programme-underperforming-and-you-know-it
More on the Marketing Canvas

Marketing Canvas by Laurent Bouty

Marketing Canvas - Magic
In our ever-evolving digital landscape, creating a memorable and unique customer experience is paramount. This article delves into the realm of 'Magic' in marketing, a concept that encourages the creation of extraordinary events throughout the customer journey. Drawing inspiration from industry-leading tools, we discuss how to inject Magic into every customer interaction. We further illuminate the role of sensory engagement and personalization, breaking down their importance in nurturing a remarkable customer journey. Unpack the significance of 'Moments of Truth', those crucial points that shape a customer's relationship with your brand. Furthermore, we explore effective evaluation techniques to ensure your strategies truly work their magic. Incorporating examples, actionable tips, and deep-dives into each concept, this article seeks to empower businesses to create enchanting customer experiences that drive loyalty and growth.
Last update: 06/12/2024
In a nutshell
The Magic sub-dimension in the Marketing Canvas is about creating exceptional moments in the customer journey that go beyond functionality. By removing obstacles, reducing stress, and delivering sensory delight, brands can elevate the customer experience and foster emotional connections. When combined with sustainability, these moments become transformative, leaving a lasting impression.
For instance, Green Clean might make its eco-friendly cleaning products a magical part of the customer journey by offering beautifully designed, refillable containers and a seamless subscription service that eliminates hassle.
Introduction
The Magic sub-dimension within the Journey category focuses on enhancing the customer experience by creating memorable, delightful, and impactful interactions. It’s not just about solving problems—it’s about exceeding expectations, protecting customers from stress, and delivering experiences that elevate their sense of identity and well-being. Infusing sustainability into these moments further strengthens the brand’s emotional resonance with its audience.
Exceptional customer experiences transform mundane interactions into magical ones, fostering loyalty and advocacy.
What is Magic?
Magic refers to the unexpected, delightful elements that enhance the customer journey. These moments are carefully crafted to:
Eliminate Friction: Identify and reduce obstacles or points of stress in the customer journey.
Deliver Comfort and Reassurance: Protect customers from uncertainty or anxiety.
Delight the Senses: Provide sensory pleasure, such as appealing visuals, sounds, or textures.
Elevate Status: Make customers feel special, appreciated, or empowered.
Integrate Sustainability: Create magical moments that are environmentally and socially responsible.
For example:
Friction Reduction: Green Clean provides auto-refill options to ensure customers never run out of cleaning supplies.
Sensory Delight: Using naturally scented, eco-friendly products that enhance the cleaning experience.
Elevated Status: Highlighting the customer’s role in supporting sustainability through their purchase.
Magic: an in-depth perspective
To create magical customer experiences, brands must:
Remove Obstacles: Identify pain points in the customer journey and minimize them to reduce undue effort.
Protect Customers from Stress: Offer clarity and reassurance at every touchpoint, eliminating confusion and uncertainty.
Delight the Senses: Infuse the customer journey with sensory experiences that engage and uplift.
Elevate Customer Status: Recognize and celebrate customers in ways that make them feel valued and important.
Prioritize Sustainable Magic: Reduce the environmental impact of creating magical moments while ensuring they align with the brand’s sustainability goals.
For instance:
Stress-Free Experience: Green Clean ensures clear, concise instructions for using its products, reducing confusion.
Sensory Appeal: Beautifully designed packaging and refreshing, natural scents create a pleasant experience.
Sustainability: All magical moments, such as eco-friendly rewards programs, are designed with minimal environmental impact.
Translating Magic into action
Crafting magical moments requires a blend of creativity, customer insight, and operational efficiency. Brands must consistently deliver experiences that surprise and delight while aligning with their values.
Questions to consider:
Have you identified and reduced obstacles in your customer journey to minimize undue energy expenditure?
How effectively do you eliminate confusion, uncertainty, and anxiety in your customer interactions?
Are your customer experiences designed to delight the senses and create memorable moments?
Do your interactions elevate your customers’ status, making them feel valued and appreciated?
How have you integrated sustainability into your magical moments to ensure they are impactful and responsible?
Statements for self-assessment
For a comprehensive evaluation of your understanding and application of the Magic concept, rate your agreement with the following statements on a scale from -3 (completely disagree) to +3 (completely agree):
You have identified obstacles across your customer journey and have reduced them where customers are expending undue energy.
You have eliminated confusion, uncertainty, and anxiety across your customer journey. Your customers are protected from stressful situations.
You have delighted the senses of your customer, as they all look for sensory pleasure (from delicious food to relaxing music).
You have provided a customer experience that elevates your customers' status.
You reduced the social and environmental impact of your efforts to create moments of truth and made sustainable moments magical.
Interpretation of the scores
Negative scores (-1 to -3): Negative scores indicate that your customer journey is filled with obstacles, stress points, or uninspired interactions. These gaps diminish customer satisfaction and loyalty. Immediate action is required to reduce friction, alleviate stress, and introduce sensory and emotional elements that create memorable experiences.
A score of zero (0): A neutral score reflects partial success in delivering magical moments. While some aspects of the journey may be effective, others lack the delight, clarity, or sustainability required to make them impactful. Further refinement is needed to enhance the emotional and sensory dimensions of the experience.
Positive scores (+1 to +3): Positive scores suggest that your customer journey consistently removes friction, protects customers from stress, and delivers delightful, sustainable experiences that elevate their status. These magical moments strengthen emotional connections with your brand, fostering loyalty and advocacy.
Case study: Green Clean’s Magic
Misaligned understanding (-3, -2, -1): Green Clean’s customer journey is filled with obstacles, such as unclear product usage instructions and difficult navigation on its website. Customers feel frustrated and undervalued, with no sensory or emotional engagement to make the experience enjoyable.
Surface understanding (0): Green Clean addresses some customer needs but fails to consistently deliver magical moments. For example, while the packaging design is visually appealing, the online ordering process is cumbersome, and sustainability claims are not clearly communicated, leaving customers with a mixed experience.
Deep understanding (+1, +2, +3): Green Clean delivers a seamless and delightful experience. Its website provides easy navigation and clear instructions, while the unboxing experience features eco-friendly, beautifully designed packaging. Customers are celebrated through personalized thank-you messages and loyalty rewards, reinforcing their status as contributors to sustainability.
Conclusion
The Magic sub-dimension is about turning ordinary customer interactions into extraordinary moments. By addressing obstacles, eliminating stress, and delivering sensory and emotional delight, brands can create lasting impressions. When combined with sustainability, these magical moments not only enhance customer satisfaction but also align with modern values, strengthening the brand’s reputation and loyalty.
Sources
Matt Watkinson, Book, The 10 Principles Behind Great Customer Experiences.
Google, Zero Moment of Truth, https://www.thinkwithgoogle.com/marketing-resources/micro-moments/zero-moment-truth/
Brian Solis, 2013, Ultimate Moment of Truth and the art of engagement, https://www.briansolis.com/2013/11/the-ultimate-moment-of-truth-and-the-art-of-engagement/
customer experience.io, Great Customer Experiences Are Effortless, https://medium.com/@_cxio/great-customer-experiences-are-effortless-2dea2f300d4e
More on the Marketing Canvas

Marketing Canvas - Channels
In a world dominated by digital and physical touchpoints, the understanding and orchestration of Channels form a crucial part of any marketing strategy. This comprehensive guide explores Channels in marketing as a sub-dimension of the Marketing Canvas by Laurent Bouty. It delves into the roles channels play in customer interactions, highlights key considerations such as interaction, information, and context, and provides practical tips on choosing the right tools.
The guide further translates these insights into action steps and underscores the significance of continuous evaluation and improvement for optimal channel performance. A detailed look into a use case example of 'Green Clean' elucidates these concepts with real-world relevance. Finally, the guide helps you assess your own marketing strategies with detailed explanations for varying scores in the evaluation process and proposes recommendations for enhancement. This guide serves as an invaluable resource for marketers, entrepreneurs, and non-marketers alike to navigate the complex terrain of channels in marketing.
Last update: 5/12/2024
In a Nutshell
The Channels sub-dimension in the Marketing Canvas focuses on the platforms and touchpoints through which customers interact with your brand. An effective channel strategy ensures that customers can access relevant and personalized experiences seamlessly, whether physical or digital, while maintaining consistency and minimizing environmental impact.
For instance, Green Clean might use both physical stores and an e-commerce platform, ensuring that customers have access to personalized product recommendations, consistent information, and eco-friendly packaging, regardless of the channel they choose.
Introduction
The Channels sub-dimension in the Journey category is essential for creating seamless and engaging customer interactions. Channels serve as the interface between your brand and your customers, facilitating communication, transactions, and service delivery. A well-orchestrated channel strategy not only meets customer expectations but also enhances their experience by ensuring relevance, personalization, and sustainability.
Effective channels are not just a means of delivering your value proposition—they are integral to shaping the overall customer journey and reinforcing your brand’s values.
What are channels?
Channels are the pathways and platforms through which customers interact with your brand. These can include:
Physical Channels: Retail stores, kiosks, in-person consultations.
Digital Channels: Websites, mobile apps, social media, and email.
Omnichannel Integration: The seamless connection of physical and digital channels to create a unified customer experience.
Effective channels:
Adapt to the customer’s context at each moment.
Offer personalized and seamless interactions.
Deliver consistent, accurate, and real-time information.
Ensure orchestration across platforms, avoiding silos.
Minimize social and environmental impact.
For example:
Physical Channel: Green Clean’s eco-friendly cleaning products are available at local stores with clear labeling.
Digital Channel: The brand’s app provides personalized recommendations and subscription services.
Omnichannel: Customers can browse online, pick up in-store, or arrange delivery with eco-friendly packaging.
Channels: an in-depth perspective
To optimize channel performance, businesses must:
Adapt to Context: Ensure customers can access the most relevant channel based on their needs at each moment.
Enable Omnichannel Integration: Provide a unified experience across physical and digital platforms, avoiding disjointed interactions.
Maintain Consistency and Accuracy: Deliver real-time, useful, and personalized information across all channels.
Orchestrate Seamlessly: Connect all channels to allow customers to transition smoothly between them.
Focus on Sustainability: Optimize physical and digital channels to reduce environmental impact and promote social responsibility.
For example:
Customer Context: Green Clean offers an app that helps customers locate nearby stockists or order online for delivery.
Omnichannel: The app integrates with in-store experiences, allowing customers to scan products for additional information or place orders for out-of-stock items.
Sustainability: All digital communications are optimized to minimize energy use, and physical deliveries are made using eco-friendly packaging.
Translating channels into action
An effective channel strategy requires alignment with customer expectations, brand values, and operational efficiency:
Customer Context: Identify customer needs and ensure channels are available and relevant at each stage of their journey.
Orchestration: Integrate all channels to avoid silos and create a seamless experience.
Sustainability: Incorporate eco-friendly practices in both physical and digital channels to reduce the brand’s environmental footprint.
Questions to consider:
Are your channels tailored to your customers’ specific context and needs at every moment?
Do your physical and digital channels offer clear, personalized, and seamless interactions?
Is the information shared across channels consistent, real-time, personalized, useful, and accurate?
Have you orchestrated your channels to eliminate silos, ensuring customers can navigate seamlessly?
How do your channels optimize social and environmental impact?
Statements for self-assessment
For a comprehensive evaluation of your understanding and application of the Channels concept, rate your agreement with the following statements on a scale from -3 (completely disagree) to +3 (completely agree):
Your customers can use the most relevant channel in function of their specific context at each moment.
Your channels are physical and digital. You provide clear, personalized, and seamless interactions, anywhere, anytime.
Information captured or shared in your channels is consistent, real-time, personalized, useful, and accurate.
You have orchestrated all your channels, and there is no silo between them. Your customers can navigate seamlessly through them at each moment.
You optimize the social and environmental impact of your physical and digital channels.
Interpretation of the scores
Negative scores (-1 to -3): Negative scores indicate significant gaps in your channel strategy, such as disjointed experiences, inconsistent information, or poor adaptation to customer context. These gaps can lead to customer frustration, weakened brand perception, and missed opportunities to promote sustainability. Immediate action is required to enhance channel integration and alignment.
A score of zero (0): A neutral score reflects partial alignment or incomplete execution of your channel strategy. While some elements may be effective, inconsistencies or silos between channels may hinder a seamless customer experience. Additional efforts are needed to fully integrate channels and optimize their social and environmental impact.
Positive scores (+1 to +3): Positive scores suggest that your channels are well-orchestrated, tailored to customer context, and consistently deliver personalized, accurate information. Your strategy integrates physical and digital channels seamlessly, enhancing customer satisfaction while promoting sustainability.
Case study: Green Clean’s channels
Misaligned understanding (-3, -2, -1): Green Clean’s channels are poorly coordinated, with no integration between its website and physical stores. Customers experience inconsistent information and limited options for switching between channels, leading to frustration and disengagement.
Surface Understanding (0): Green Clean offers basic functionality across its channels, such as a website and in-store availability, but fails to fully integrate them. While customers can purchase products online or in-store, they cannot seamlessly transition between these options, and sustainability efforts are minimal.
Deep Understanding (+1, +2, +3): Green Clean delivers a fully integrated channel strategy. Customers can explore products online, check in-store availability, and order for delivery or pick-up seamlessly. The brand provides consistent, personalized information across all touchpoints, while minimizing environmental impact through eco-friendly packaging and sustainable delivery practices.
Conclusion
The Channels sub-dimension is critical for delivering seamless, customer-centric interactions that align with brand values and sustainability goals. By integrating physical and digital channels, maintaining consistency and accuracy, and optimizing environmental impact, businesses can create a cohesive and impactful customer journey.
Sources
Wikipedia, Omnichannel, https://en.m.wikipedia.org/wiki/Omnichannel