Marketing strategy that works
in the real world.
Framework deep-dives, archetype guides, and research analysis built on the 24 dimensions of the Marketing Canvas Method.
Don't know your archetype yet?
12 minutes. 24 dimensions scored on a forced-choice scale. You get your Strategic Archetype, your Vital 8 against target, and your Fatal Brakes flagged — before you read anything else.
Get the scoring worksheets.
6 printable A4 scoring grids for running the MCM assessment with your team — no screen required.
No sales emails. GDPR-compliant. Unsubscribe any time.
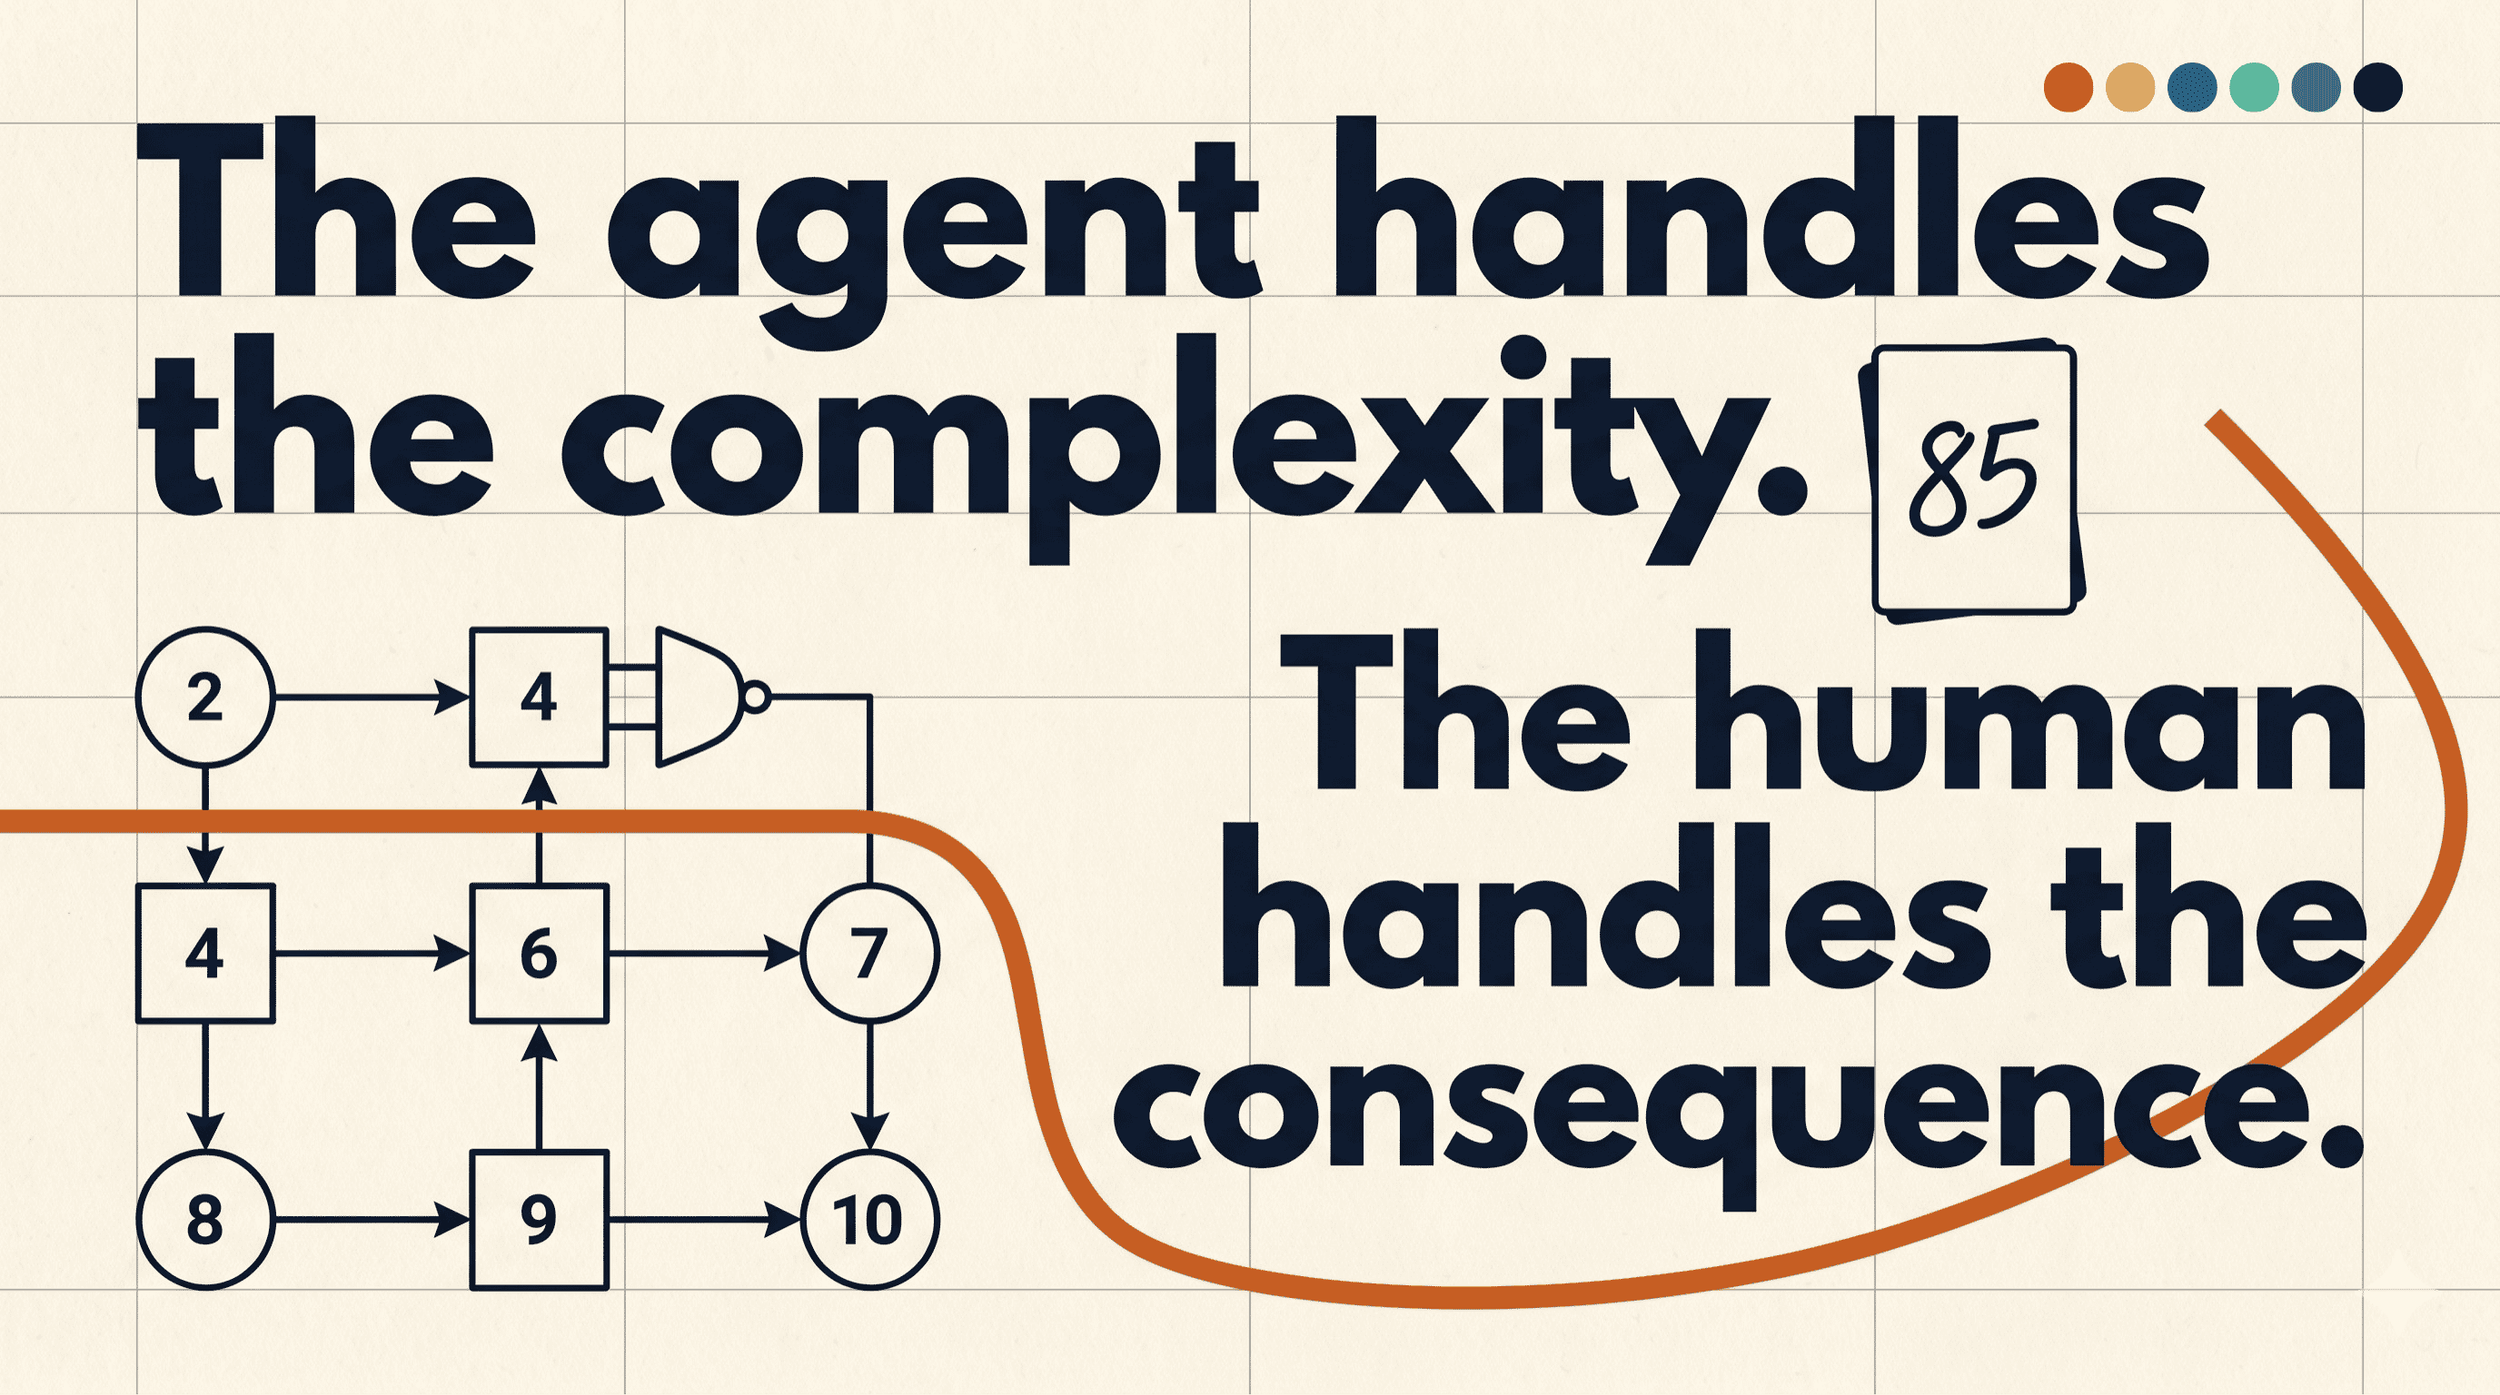
Marketing Strategy in an Agentic World
AI agents are now completing transactions on behalf of consumers — without visiting your website, reading your reviews, or seeing your ads. Your brand is being represented, recommended, or overlooked by systems you don't control. Most marketing frameworks weren't built for that. The Marketing Canvas Method was.
Marketing Canvas - Budget
Budget is the 24th Marketing Canvas dimension — scoring not how much you spend, but how deliberately. Learn the four properties, the 3-Cycle allocation logic, and the 90/10 innovation reserve principle.
Marketing Canvas - Pricing
Pricing errors run in both directions. Underpricing signals low quality and leaves margin on the table. Overpricing creates resentment no feature list can fix. Dimension 330 of the Marketing Canvas scores whether your pricing actively supports your positioning — or quietly contradicts it.
Marketing Canvas - Engagement
Satisfaction and engagement are not the same thing. A customer can score 7/10 on satisfaction and never return. Dimension 140 of the Marketing Canvas explains the difference, how to measure it, and why engagement is the leading indicator that predicts churn before it appears in the revenue line.

Marketing Strategy Execution - How to start a movement?
Most of the time, I am facing the situation where I need to engage people in executing the strategy. Easy to say but probably the most difficult part of being a CMO (make it happen).

Marketing Strategy for Millennials from Marketing Cloud
Interesting Infographic from Marketing Cloud proposing 5 steps to creating your Marketing Strategy for Millennials. As you might have noticed, I am advocating the use of the Marketing Canvas for designing your Marketing Strategy. Let's check whether these steps fit into the process?


Questions you should ask with the Marketing Canvas
Marketing canvas is an easy yet powerful tool you can use for assessing your Marketing Strategy. It works for small and very large companies. It can be used by novices or experts. A list of key questions to be asked can be found in this article. Enjoy!
Why you need a bold question for your Marketing Strategy?
What is the best way to start defining the marketing strategy of your company, business or activity? My proposal is to start with a bold strategic question! Why?
Marketing Strategy in Context
If you want to design the marketing strategy for your business, you should first start to analyse where you will play. What does it mean? It means that your product/service will be associated by consumers/buyers with other alternatives they have on the market (maybe no alternative exists which means that you creating a new category also referred as a blue ocean).

How to get real insights for your Marketing Strategy?
Collection of videos talking about insights.