BLOG
A collection of article and ideas that help Smart Marketers to become Smarter
Marketing Canvas - Step 2 - Set Your Goals
In the Marketing Canvas Process, after having finalised your assessment, you should discuss potential scenarios that will help you achieve your goal(s). An interesting perspective for this phase is to use the scenarios proposed by Tiffani Boffa in her book Growth IQ.
The Marketing Canvas, developed by Laurent Bouty, is a powerful tool that provides a structured approach to crafting a robust marketing strategy. It's a co-creation method that intersects your environment (where you will play), your goals (what you would like to achieve), and your actions (what you will do). This article focuses on the second step of the Marketing Canvas Process - setting your goals. This step is vital as it serves as the reference point for the assessment phase.
Three Strategies for Growing Your Revenue:
In the Marketing Canvas Process, three strategies are highlighted for growing your revenue: GET, KEEP, and STIMULATE/MORE. These strategies focus on different aspects of customer interaction and are designed to help businesses increase their revenue.
GET: This strategy is all about customer acquisition. The primary idea is that your business can grow by attracting new customers. Tactics that can be employed include acquisition campaigns (welcome offers), channel incentives for new customers, "bring a friend" campaigns, and freemium models. For instance, a new restaurant might offer a "buy one get one free" deal to attract new customers.
KEEP: The second strategy emphasizes customer retention. The main idea here is that your business can grow by retaining existing customers. This strategy might seem defensive, but it is the cornerstone of customer experience and is essential for all businesses, including startups. Tactics include churn management, loyalty programs, brand and customer experience reinforcement, Net Promoter Score (NPS) programs for detractors, and below-the-line retention campaigns. For example, a software-as-a-service (SaaS) company might implement a loyalty program that offers exclusive features or discounts to long-term subscribers.
STIMULATE/MORE: The third strategy focuses on customer stimulation. The primary idea is that your business can grow by encouraging your customers to spend more and/or more often. Tactics include cross-selling, upselling, promotion campaigns for usage stimulation, bundling, upgrade programs, and premium features. For instance, a telecom company might offer a bundle that includes internet, cable, and phone services at a discounted rate, encouraging customers to spend more.
Green Clean Use Case:
To illustrate these strategies, let's consider a hypothetical company, Green Clean, a startup offering eco-friendly cleaning services.
For the GET strategy, Green Clean could offer a discounted first cleaning service to attract new customers. They could also implement a referral program where existing customers get a discount for each new customer they bring in.
For the KEEP strategy, Green Clean could develop a loyalty program where customers get a free cleaning service for every ten services purchased. They could also focus on providing excellent customer service to ensure customer satisfaction and reduce churn.
For the STIMULATE/MORE strategy, Green Clean could offer additional services like deep carpet cleaning or window cleaning, encouraging existing customers to spend more. They could also offer a premium subscription service that includes regular cleaning and maintenance services.
Conclusion
Setting your goals is a crucial step in the Marketing Canvas Process. It provides a clear direction for your marketing efforts and serves as a reference point for assessing your progress. The three strategies - GET, KEEP, and STIMULATE/MORE - offer different approaches to growing your revenue. By understanding these strategies and how to apply them, businesses can create a robust marketing strategy that drives growth and success.
Remember, the Marketing Canvas is a dynamic tool. As your business environment changes, you should revisit your goals and strategies to ensure they remain relevant and effective. Regular review and adaptation are key to maintaining a successful marketing strategy.
Whether you're a non-marketer, an entrepreneur, or a marketer looking to learn something new, the Marketing Canvas offersa structured yet flexible approach to developing a marketing strategy. It breaks down complex marketing concepts into manageable steps, making the process more accessible and less intimidating.
The Marketing Canvas is not just a tool, but a journey. It's a process of discovery, assessment, and reinforcement. It's about understanding your market, setting clear goals, and determining the actions you need to take to achieve those goals.
So, are you ready to embark on this journey? Are you ready to set your goals and grow your business? Remember, the journey of a thousand miles begins with a single step. In the case of the Marketing Canvas, that step is setting your goals.
Marketing Canvas - Listening
Most companies listen reactively — processing complaints, running annual surveys, reading reviews when they arrive. The Marketing Canvas demands proactive listening. Dimension 510 explains the difference, why it is a Fatal Brake for Pivot Pioneers, and the most expensive sentence in marketing.
About the Marketing Canvas Method
This article covers dimension 510 — Listening, part of the
Conversation meta-category. The Marketing Canvas Method structures
marketing strategy across 24 dimensions and 9 strategic archetypes.
Full framework reference at
marketingcanvas.net →
·
Get the book →
In a nutshell
Listening (dimension 510) is the Voice of the Customer (VOC) infrastructure — not a single survey, but a system that captures everything customers say across every channel, translates it into data, and feeds it into strategic decisions.
The distinction that defines this dimension: listening without action is surveillance. Listening with action is strategy.
Most organisations believe they listen to customers. Most are listening reactively — processing complaints when they arrive, running annual satisfaction surveys, reading reviews when a notification appears. The method demands something more demanding: proactive listening that generates data before it is needed, feeds it into decisions before problems compound, and closes the loop between what customers say and what the company does.
In the Marketing Canvas, Listening sits within the Conversation meta-category alongside Stories (520), Media (530), and Influencers (540). It is the first of the four Conversation dimensions — and it comes first deliberately. The meta-category header says it plainly: listening comes before stories, before media, before influencers. You cannot communicate effectively with people you haven't systematically understood.
Reactive vs. proactive: the canonical distinction
This is the distinction that separates a company with VOC processes from a company with a VOC system.
Reactive listening processes information when it arrives. Customer complains — the complaint is logged. Customer writes a review — someone reads it. Annual survey goes out — results are compiled. NPS score is reported quarterly. Each of these is listening. None of them is proactive. The information arrives at the company's pace, on the company's schedule, filtered through the customers who bothered to respond.
Proactive listening generates information continuously, systematically, and before it is urgently needed. Ongoing customer interviews on a regular cadence — not just when there is a problem to investigate. Social listening infrastructure monitoring what is said about the brand, the category, and competitors across platforms. Support ticket analysis that extracts pattern data from thousands of micro-interactions. Behavioural data from digital touchpoints that reveals what customers actually do, not just what they say. Structured feedback loops at defined journey stages that close the circle between hearing a concern and confirming the fix.
The gap between reactive and proactive is the gap between responding to problems and preventing them. Between knowing what customers said last quarter and knowing what they are saying now. Between confirming assumptions and challenging them.
The canonical test: if the company stopped sending surveys tomorrow, would customer understanding continue to improve? If yes, the listening system is proactive. If no — if surveys are the primary input — the system is reactive, and dimension 510 cannot score above +1.
The most expensive sentence in marketing
"We know what customers want."
This sentence costs more than any misaligned campaign, any failed product launch, or any churned enterprise account. It is the signal that internal assumptions have been allowed to substitute for external evidence — that the listening loop has been closed not by data but by conviction.
The canonical position of the Marketing Canvas on this: if the data contradicts the assumption, the assumption must yield. Not the data. Not the interpretation. The assumption.
This sounds obvious. It is routinely violated. Teams that have operated in a category for years develop a fluency with their customers that feels like understanding but is actually pattern recognition. They know what last year's customers said about last year's product. They extrapolate. The market moves. The extrapolation drifts.
The VOC system exists to correct the drift before it becomes a strategy gap. It is the institutional mechanism that keeps the company's model of its customers honest — continuously updated, data-grounded, and resistant to the internal assumptions that are far more comfortable to rely on.
The four properties of an effective VOC system
The Marketing Canvas scores Listening against four properties. Together they describe not just whether a company has listening tools, but whether those tools form a functioning system:
Capture scope (511) — does the VOC system hear everything customers are saying? Not everything worth hearing — everything. The signal that matters is often not in the formal feedback. It is in the support ticket that uses unusual language. The social media comment that frames the category differently. The customer interview that introduces a word the team has never used. A VOC system with limited capture scope is a VOC system with systematic blind spots.
Data discipline (512) — is the VOC process entirely data-driven, with no point where assumptions substitute for evidence? The failure mode here is not fraudulent data. It is filtered data — interview questions that lead to expected answers, survey scales that cluster around mid-range because respondents are conflict-averse, analysis that confirms the hypothesis the team walked in with. Data discipline means designing the listening system to surface inconvenient truths, not just validate comfortable ones.
Journey integration (513) — does the VOC process map to the customer lifecycle? Listening at only one stage of the journey is like taking a patient's temperature once and declaring the health of their entire year. The research that matters for acquisition decisions is different from the research that matters for retention decisions. A journey-integrated VOC system has different listening mechanisms at different stages — capturing the before-purchase research experience, the onboarding moment, the ongoing use patterns, and the renewal conversation separately, because each reveals different strategic information.
Methodological breadth (514) — are multiple research techniques used together? Each technique has a different blind spot. Surveys capture stated preferences but miss revealed behaviour. Interviews surface nuance but are prone to social desirability bias. Behavioural analytics reveal what customers do but not why. Support ticket analysis captures the most frustrated customers but underweights the quietly satisfied ones. No single technique is sufficient. The system that combines four or more creates a triangulated picture that is harder to misread.
Validation discipline — does the company run a JTBD check at the customer level before committing capital to a direction implied by a market signal? A strong market trend is not the same as a validated consumer job. A company can detect a trend correctly and still deploy capital in a direction its specific customer does not need, because it never ran the validation step between signal and decision. This failure is harder to catch because the company genuinely believes it is being data-driven. The tell: VOC data is being used to confirm a direction already chosen, rather than to test it before capital is committed. Volume of consumer data does not protect against this failure. Only validation discipline does.
The second critical failure is the mirror of the first: companies that mistake market signal intake for customer listening. Reactive companies filter data through assumptions. A different failure mode — harder to detect because it is dressed in data — is the company that tracks macro trends attentively but never validates them at the individual customer level. The market is moving toward X does not mean your specific customer's job has changed. Listening without validation is still surveillance, just at a more sophisticated level.
Listening in the Marketing Canvas
The canonical question
Do you systematically capture, analyse, and act on what customers are saying about your brand, products, and market?
Listening is a Fatal Brake for A5 (Pivot Pioneer) — the most strategically consequential placement of any Conversation dimension.
The rationale is direct: you cannot pivot successfully if you don't know where the market is going and whether your specific customer is moving with it. Listening is how you find out both — and the second question matters more than the first.
The Fujifilm and Kodak cases provide the sharpest possible contrast. Both companies faced the same crisis in the early 2000s: digital technology was destroying the photographic film market. Both had data. Kodak had commissioned research in 1981 predicting film's decline — and then calculated how many years they could milk film revenue before needing to act. They listened, and then filtered the listening through their assumption that they had more time. Fujifilm conducted an 18-month technology audit — described in the canonical case library as "the most sophisticated VOC exercise in the book" — mapping every capability they had against every market need they could identify. They listened, and then let the data direct the strategy. Fujifilm still exists. Kodak destroyed over €100B in value.
For A5, Listening is a Fatal Brake because the pivot direction is unknown until the market reveals it. An A5 company that is listening well will identify the new job before competitors do. An A5 company that is listening reactively will discover it in competitors' press releases.
Listening is also a Growth Driver for A9 (Category Creator) — the dimension through which category language is discovered. Green Clean's voice-of-customer language mining is the canonical example: extracting the exact phrases customers used to describe the indoor health protection job and feeding those phrases directly into marketing copy. Customers teach you the vocabulary of the category they are joining. Listening is how you learn it.
Statements for self-assessment
Rate your agreement on a scale from −3 (completely disagree) to +3 (completely agree). There is no zero — the Marketing Canvas forces a directional position on every dimension.
Note on Detailed Track scoring: if averaging sub-question scores produces a mathematical zero, the method rounds to −1. A split score means the dimension is not clearly helping your goal — and "not clearly helping" requires the same investigation as "hurting."
Interpreting your scores
Negative scores (−1 to −3): Customer understanding relies on assumptions, single-source data, or reactive feedback that arrives too late to be strategic. "We know what customers want" is the operating assumption. The likely result: strategy decisions are made on the basis of internal conviction rather than external evidence. Problems compound before they are detected. For A5, this score is existential — a pivot built on assumed market direction is a rebrand, not a transformation.
Positive scores (+1 to +3): Multiple listening channels feed a structured process that visibly influences product, marketing, and service decisions. Every significant strategy decision can be traced back to a specific customer insight from a specific source. The VOC system generates evidence before it is urgently needed, corrects internal assumptions when data contradicts them, and closes the loop between what customers say and what the company does.
Case study: Green Clean
Green Clean is a fictional eco-friendly residential cleaning service used as the recurring worked example throughout the Marketing Canvas Method.
Score: −2 to −1 (Weak) Green Clean's listening consists of a post-service satisfaction email sent to every customer after each visit. The response rate is 19%. The four questions (overall satisfaction, cleaner performance, product quality, likelihood to recommend) produce scores the team reviews monthly. No action has been taken based on these scores in the past six months — they are tracked but not acted on. Customer interviews have never been conducted. Social media is monitored by the founder personally, approximately once a week, without a systematic process for capturing or analysing what is found. Support tickets are answered and then closed, with no aggregation or pattern analysis. "We know what our customers want" is the informal position of the team. The VOC system exists in form. It does not function as strategy.
Score: +1 to +2 (Developing) Green Clean has introduced quarterly customer feedback sessions — 45-minute conversations with a rotating group of 8–10 customers focused on the full service journey. The sessions are structured but not scripted: customers describe specific moments rather than rate abstract attributes. Two rounds of sessions have already produced one significant insight: customers consistently describe the moment they realise the Family Health Report is personalised to their specific home as the point when they first trusted the brand. This insight was not available from the satisfaction survey. The team has started acting on it: the first Health Report for new customers is now delivered with a phone call rather than an email, specifically to confirm the personalisation in conversation. Social listening is now monitored daily using a basic tool. Support ticket language is being reviewed weekly for recurring patterns. Proactive listening is forming. It is not yet systematic.
Score: +2 to +3 (Strong) Green Clean's VOC system operates at four levels simultaneously. Satisfaction data (post-service NPS) provides the quantitative baseline. Quarterly customer interviews provide the qualitative depth, including specific language analysis — the team has documented the exact phrases health-conscious parents use to describe the indoor health protection job and has fed those phrases directly into website copy, sales conversations, and the Family Health Report narrative. Social listening captures every mention of Green Clean and its category terms in the region, updated daily. Support ticket analysis is reviewed weekly and produces a monthly "friction report" — specific interaction patterns that indicate friction in the journey. Each of these data streams feeds into monthly strategy reviews where at least one decision is required to trace back to VOC evidence. The system has produced three product changes and two messaging updates in the past twelve months. When the team states what customers want, they can cite the specific data source, the sample size, and the date the insight was captured.
Connected dimensions
Listening does not operate in isolation. Five dimensions connect most directly:
110 — JTBD: Listening enables the initial evidence base for the job definition — and, more critically, maintains its accuracy over time. A company can define the job well in year one and then watch it silently decay if no VOC system is actively testing whether the definition still holds. Without 510, a correct 110 ages in amber while the customer's actual job evolves. 510 is how you build 110. It is also how you keep it honest.
130 — Pains & Gains: VOC validates pain mapping. The pains identified in journey research (dimension 130) are hypotheses until the VOC system confirms them with data across a sufficient sample. Pains that appear in one customer interview may be individual; pains that appear in twelve are systemic. Listening is how the difference is established.
140 — Engagement: VOC systems feed engagement data. The promoter/detractor ratios that dimension 140 scores are produced by the listening infrastructure. Without a functioning VOC system, Engagement can only be measured by satisfaction surveys — which, as noted in dimension 140, is not the same as measuring engagement.
420 — Experience: Listening reveals what the experience actually feels like from the customer side. A team that believes the onboarding experience is +2 on Experience may discover through customer interviews that the specific moment the substitute cleaner arrives without prior notice is scoring −2 in the customer's head. Without the listening system, the Experience score is a self-assessment. With it, it becomes evidence-based.
520 — Stories: Listening provides the customer language that makes stories resonate. The most effective content uses the words customers use to describe their own problems — not the words the marketing team uses to describe the product. VOC language mining is the process that produces the raw material for story strategy.
Conclusion
Listening is the first Conversation dimension because it is the prerequisite for all the others. A brand cannot tell credible stories without knowing what customers actually experience. It cannot design effective media without knowing which messages resonate. It cannot identify the right influencers without knowing which voices customers trust.
The strategic test is not whether the company has feedback mechanisms. It is whether those mechanisms are proactive, multi-technique, journey-integrated, and action-connected. A company that sends satisfaction surveys and reads the results is listening. A company that conducts ongoing interviews, monitors social conversation, analyses support ticket patterns, tracks behavioural data, and ties every decision to a specific customer insight is listening strategically.
The difference between those two companies is not tools. It is discipline — the discipline of requiring data to yield when it contradicts assumption, rather than requiring assumption to explain away inconvenient data.
Sources
Harvard Business Review, "Everyone Says They Listen to Their Customers — Here's How to Really Do It", October 2015 — hbr.org
McKinsey & Company, "Are You Really Listening to What Your Customers Are Saying?", McKinsey Quarterly — mckinsey.com
Marketing Canvas Method, Appendix E — Dimension 510: Listening (VOC), Laurent Bouty, 2026
About this dimension
Dimension 510 — Listening (VOC) is part of the Conversation meta-category (500) in the Marketing Canvas Method. The Conversation meta-category contains four dimensions: Listening (510), Stories (520), Media (530), and Influencers (540).
The Marketing Canvas Method is a complete marketing strategy framework built around 6 meta-categories, 24 dimensions, and 9 strategic archetypes. Learn more at marketingcanvas.net or in the book Marketing Strategy, Programmed by Laurent Bouty.
Marketing Canvas - Magic
Satisfaction keeps customers. Magic turns them into advocates. Dimension 440 of the Marketing Canvas scores four components — effortless, stress-free, sensory pleasure, and social pleasure — and explains why exceeding expectations on something the customer doesn't care about isn't magic, it's waste.
About the Marketing Canvas Method
This article covers dimension 440 — Magic, part of the
Journey meta-category. The Marketing Canvas Method structures
marketing strategy across 24 dimensions and 9 strategic archetypes.
Full framework reference at
marketingcanvas.net →
·
Get the book →
In a nutshell
Magic (dimension 440) scores whether your brand exceeds expectations in ways customers didn't anticipate. Not satisfaction — that is delivering what was promised. Not quality — that is consistency. Magic is the surprise that transforms a satisfied customer into an active advocate.
The most important design principle: exceeding expectations on something the customer doesn't care about isn't magic. It's waste. Magic requires knowing what the customer expects — and then strategically exceeding it at the moment that matters most.
In the Marketing Canvas, Magic sits within the Journey meta-category alongside Moments (410), Experience (420), and Channels (430). It is the peak layer — the dimension that elevates a reliable experience into one customers feel compelled to describe to others. Experience (420) sets the baseline. Magic (440) creates the highs above it.
Magic vs. Experience: the critical distinction
This is the most important conceptual clarification in dimension 440, and the one most commonly missed in workshops.
Experience (420) scores the consistent baseline — whether every customer, in every interaction, receives a response that is intentional, reliable, and meets expectations. Consistency is the standard. A strong Experience score means: nothing is left to chance, the brand's promise is defended at every touchpoint.
Magic (440) scores the peaks — the unexpected moments that exceed what the customer anticipated and produce the emotional response that generates advocacy. Magic is not consistent by definition. It is strategic and selective — designed to occur at the specific moments where the surprise will have the highest impact.
The sequencing rule: fix Experience before investing in Magic. A brand with a −1 on Experience that invests in Magic initiatives is adding peaks to an unreliable baseline. Customers who encounter magic at one touchpoint and inconsistency at another do not become advocates. They become confused — and confusion precedes churn, not advocacy.
Score negative if the customer journey is functional but unremarkable, or if it creates friction the company hasn't noticed. Score positive when specific moments are designed to exceed expectations and customers spontaneously share those moments with others.
The four components of Magic
The Marketing Canvas breaks Magic into four scored components — each addressing a different dimension of the unexpected experience:
Effortless (441) — obstacles removed. The customer expects friction; they encounter none. The booking that takes 30 seconds when they budgeted 5 minutes. The form that pre-fills from their previous interaction. The return process that requires no explanation because the system already knows why. Effortlessness is the absence of friction the customer had learned to expect. It is magical precisely because the absence is unexpected — the category has trained customers to tolerate effort, and the brand has made it disappear.
Stress-free (442) — confusion, uncertainty, and anxiety eliminated. The customer expects to worry about something; they find there is nothing to worry about. The ambiguous delivery window that turns into real-time location tracking. The ingredient claim that is accompanied by independent verification rather than asking the customer to trust. The post-service question that is answered before it was asked. Stress-free magic is the proactive removal of cognitive load — the brand doing the worrying so the customer does not have to.
Sensory pleasure (443) — delight through sight, touch, sound, taste, or smell. In consumer markets this is the Apple unboxing, the Hermès ribbon, the hotel that remembers a pillow preference. The experience engages the senses in a way that exceeds the purely functional expectation. In service contexts, sensory pleasure appears in the aesthetics of a delivered report, the warmth of an unexpected handwritten note, the packaging that communicates care before a word is read.
Social pleasure (444) — status elevation. The customer encounters the brand in a way that makes them feel recognised, celebrated, or elevated in front of others. The loyalty recognition at a hotel check-in that happens in front of other guests. The personalised annual impact report that the customer shows to friends because it makes them look like someone who has made a difference. The referral confirmation that acknowledges the customer as a trusted advisor to their network. Social pleasure magic is the brand giving the customer a story they want to tell.
B2B Magic: cognitive, not sensory
In consumer markets, Magic is often sensory — the unboxing, the ribbon, the pillow preference. In B2B, Magic is cognitive: the insight the client didn't ask for, the risk flagged before it became a problem, the deliverable completed three weeks early without explanation.
The NTT Data case illustrates the distinction. B2B Magic isn't about delight in the consumer sense. It is about demonstrating competence so completely and proactively that the client forms the belief: "this is a genuine partner, not just a vendor." That belief is the B2B equivalent of advocacy — the CTO who mentions the vendor by name at an industry conference, the COO who recommends the firm without being asked, the procurement lead who shortcuts the RFP process because they already know who they want.
The B2B Magic design question: where in this engagement does the client expect reasonable competence — and where could we deliver something so far ahead of expectation that it changes the nature of the relationship?
Spotify's Discover Weekly is the canonical example of consumer-facing Magic that operates on a cognitive principle: the algorithm's ability to surface music the user didn't know they wanted, at the moment they most want it. Not sensory delight. Cognitive surprise. The user's reaction — "how does it know?" — is the Magic response. It drove measurable retention improvement, which is the commercial test of whether Magic is working.
Magic in the Marketing Canvas
The canonical question
Where do you exceed expectations in ways customers didn't see coming?
Magic appears in the Vital 8 of five archetypes — spanning the full range of strategic roles:
Fatal Brake for A7 (Scale-Up Guardian): Hypergrowth tends to destroy the exceptional experiences that created growth in the first place. The early customers of a high-growth brand experienced something that felt personal, attentive, and unexpectedly good — because the team was small, the founder was involved, and every interaction was high-touch. As the company scales, processes replace people, automation replaces attention, and the magic that converted early adopters into evangelists disappears into a standardised service. For A7, Magic is a Fatal Brake because losing it is the mechanism through which growth erodes the advocacy that funded growth. It must reach ≥+2 before hypergrowth investment can be sustained.
Primary Accelerator for A2 (Efficiency Machine): For the Efficiency Machine, Magic means the customer barely notices the transaction happened. The 25-minute Ryanair turnaround. The Amazon checkout that requires one click. The banking app that reconciles the account before the customer closes the browser. In A2, operational magic is not sensory delight — it is the complete removal of the customer's effort. The customer doesn't tell a story about the experience; they tell a story about the absence of one. "I barely had to do anything" is the A2 Magic response.
Secondary Brake for A6 (Value Harvester): A Value Harvester extracting maximum cash flow from an existing base must maintain enough magic to prevent the churn that would otherwise accelerate as the product matures. Magic maintenance for A6 is defensive — enough unexpected value to remind customers why they stay, even as the brand optimises for margin rather than growth.
Secondary Accelerator for A4 (Stagnant Leader): For a stagnant leader fighting churn, Magic initiatives provide the proof of renewal that keeps the existing base engaged while Experience (420) and Features (310) are being rebuilt. A single well-designed magical moment — the AI-powered feature that anticipates the user's next action, the proactive support contact that prevents a problem before it occurs — signals that the brand is still invested in the relationship.
Growth Driver for A6: For the Value Harvester, Magic initiatives that generate advocacy are a low-cost acquisition mechanism that complements the margin extraction strategy. Existing customers who experience unexpected delight become the most credible referral source for the next customer cohort.
Statements for self-assessment
Rate your agreement on a scale from −3 (completely disagree) to +3 (completely agree). There is no zero — the Marketing Canvas forces a directional position on every dimension.
Note on Detailed Track scoring: if averaging sub-question scores produces a mathematical zero, the method rounds to −1. A split score means the dimension is not clearly helping your goal — and "not clearly helping" requires the same investigation as "hurting."
Interpreting your scores
Negative scores (−1 to −3): The customer journey is functional but unremarkable. There are no designed moments of unexpected delight. Customers are satisfied but not moved to advocate. Worse: friction and anxiety may exist that the team hasn't noticed because nobody has mapped the journey from the customer's perspective. For A7, a negative score here explains why growth is eroding the advocacy that created it.
Positive scores (+1 to +3): Specific moments are designed to exceed expectations across one or more of the four components. Customers spontaneously share those moments with others — in conversation, in reviews, in referrals. Magic is functioning as the advocacy generation mechanism: not all customers experience it, but the ones who do become the brand's most effective acquisition channel.
Case study: Green Clean
Green Clean is a fictional eco-friendly residential cleaning service used as the recurring worked example throughout the Marketing Canvas Method.
Score: −2 to −1 (Weak) Green Clean's customer journey is functional and unremarkable. The booking works. The cleaner arrives. The cleaning is done. But nothing about the interaction exceeds what a customer would expect from a competent cleaning service. There are no designed moments of effortlessness — the booking process requires four steps that could be two. There is no stress removal — customers who want to verify what products were used have to ask, and the answer varies by team member. There is no sensory pleasure — the cleaner leaves without any communication, the invoice arrives two days later as a plain text email. There is no social pleasure — the service produces no story the customer would want to share. When existing customers describe the service, they use words like "reliable" and "good" — the language of satisfied, disengaged customers rather than active advocates.
Score: +1 to +2 (Developing) Green Clean has introduced two designed Magic moments. First: the Family Health Report arrives within 6 hours of service completion — a specific, data-rich document that no competitor provides and that customers describe as "not what I expected" when they receive it for the first time. This addresses the stress-free component: customers who would have worried about whether the claims are real now have evidence without asking for it. Second: on the third service, customers receive a personalised summary of their cumulative impact — how many service visits, how many households protected from chemical exposure, how much waste has not been generated. This addresses social pleasure: customers who care about environmental responsibility have a number they can share. These two moments are working — the referral rate has started to climb. But the effortless and sensory pleasure components remain undesigned.
Score: +2 to +3 (Strong) Green Clean has designed Magic moments across all four components. Effortless: the booking takes 90 seconds on mobile, with address pre-filled and service preferences remembered. Scheduling confirmation and reminder are automatic. Stress-free: the Family Health Report arrives within 6 hours with a plain-language explanation of what was found and eliminated. Customers never have to ask. Sensory pleasure: the cleaner leaves a handwritten note summarising what was done in this specific home, with one personalised observation (a comment on the kitchen herbs, a note about the child's artwork visible from the bathroom). The note costs 3 minutes and generates more customer responses than any other touchpoint. Social pleasure: the annual impact statement — "Your household prevented 42kg of chemical exposure in 2024" — is designed as a shareable card with Green Clean's visual identity. 23% of customers share it on social media or forward it to friends. The referral rate reached 35% by 2024. Customers do not describe the service as "good." They describe specific moments that changed how they think about what a cleaning service can be.
Connected dimensions
Magic does not operate in isolation. Four dimensions connect most directly:
130 — Pains & Gains: Magic eliminates pains and creates unexpected gains. The pain map is the source material for effortless and stress-free Magic design. When a pain is eliminated so completely that the customer barely registers its absence, that is effortless Magic. When a gain exceeds what the customer expected, that is the raw material of the sensory and social pleasure components.
420 — Experience: Magic elevates experience beyond consistency. Experience (420) sets the reliable baseline. Magic (440) creates the moments above it. The two dimensions work in sequence: without a consistent Experience baseline, Magic investments are undermined by the inconsistency that surrounds them.
320 — Emotions: Magic creates peak emotional moments. The surprise that generates advocacy is an emotional event — the "I didn't expect that" feeling that produces the story worth telling. Magic moments are the designed delivery mechanism for peak emotional benefits.
140 — Engagement: Magic drives engagement and advocacy. A customer who has experienced a designed Magic moment is more likely to be a promoter on the NPS scale, more likely to refer, and more likely to provide feedback. Magic is the upstream cause; Engagement (140) measures the downstream effect.
Conclusion
Magic is the dimension that answers the question most brands cannot: why do some customers become advocates when others merely stay?
The answer is not product quality. Quality is expected. It is not service consistency. Consistency is the baseline. It is the specific, unexpected moment that exceeds what the customer had learned to anticipate — the report that arrives before they asked, the note that references their home specifically, the status recognition that makes them feel seen.
The design principle that separates effective Magic from wasted investment: it must exceed expectations on something the customer actually cares about. The hotel that remembers a pillow preference is Magic because sleep quality matters. The hotel that provides a turndown chocolate to a customer who explicitly avoids sugar has produced an interaction, not a magic moment.
Knowing what customers expect — and where exceeding it will produce the highest advocacy response — is the work. The four components (effortless, stress-free, sensory pleasure, social pleasure) provide the framework. The Moments map (410) and the Pains & Gains research (130) provide the evidence. Together, they produce the design brief for Magic initiatives that convert satisfied customers into advocates.
Sources
Chip Heath, Dan Heath, The Power of Moments: Why Certain Experiences Have Extraordinary Impact, Simon & Schuster, 2017
Matt Watkinson, The Ten Principles Behind Great Customer Experiences, FT Publishing, 2013
Marketing Canvas Method, Appendix E — Dimension 440: Magic, Laurent Bouty, 2026
About this dimension
Dimension 440 — Magic is part of the Journey meta-category (400) in the Marketing Canvas Method. The Journey meta-category contains four dimensions: Moments (410), Experience (420), Channels (430), and Magic (440).
The Marketing Canvas Method is a complete marketing strategy framework built around 6 meta-categories, 24 dimensions, and 9 strategic archetypes. Learn more at marketingcanvas.net or in the book Marketing Strategy, Programmed by Laurent Bouty.
Marketing Canvas - Channels
Most companies have channels. Few have orchestrated channels. Dimension 430 of the Marketing Canvas scores the difference — and explains why a brand with three connected channels outperforms one with eight siloed ones.
About the Marketing Canvas Method
This article covers dimension 430 — Channels, part of the
Journey meta-category. The Marketing Canvas Method structures
marketing strategy across 24 dimensions and 9 strategic archetypes.
Full framework reference at
marketingcanvas.net →
·
Get the book →
In a nutshell
Channels (dimension 430) scores how customers interact with your brand — physical and digital, owned and third-party — and whether those interactions form a seamless, coherent experience across all of them.
The canonical distinction that defines this dimension: most companies have channels. Few have orchestrated channels. The score measures orchestration, not presence.
A brand with a website, a mobile app, a social media presence, a phone line, and a field team is not necessarily scoring well on dimension 430. The question is whether those channels work together without silos — whether a customer who starts research on one channel can complete the journey seamlessly on another, and whether the company can track and serve that customer across the transition.
In the Marketing Canvas, Channels sits within the Journey meta-category alongside Moments (410), Experience (420), and Magic (440). It is the delivery infrastructure — the system that ensures every moment designed in 410 is actually accessible to the customer in the format that serves them best.
Presence vs. orchestration: the canonical distinction
Every company has channels. Most companies have more channels than they have resources to maintain well. The channel list is not the dimension. The orchestration of that list is.
The test is a single customer journey across multiple channels. A customer who discovers Green Clean through a health parenting blog, visits the website to research the formula, emails a question about ingredient safety, books a service via the app, receives the Family Health Report by email, and calls to ask about a recurring subscription — has touched five channels. If the experience is continuous (the phone call picks up where the booking left off; the subscription question doesn't require re-explaining the service model), the channels are orchestrated. If each channel treats the customer as a stranger, the channels exist but are not orchestrated.
The canonical four properties that define orchestrated channels:
Context (431) — can customers use the most relevant channel for their specific situation at each moment? A customer researching a service in the evening needs findable, credible content on the web. A customer mid-service with a question needs an immediate human response. A customer reviewing their health report at midnight needs a digital self-service interface. The same channel cannot serve all three moments well.
Interaction quality (432) — do channels provide clear, personalised, seamless interactions? Quality here means the interaction is adapted to the customer's identity and context — not generic, not one-size-fits-all, not a copy-paste template.
Information consistency (433) — is data consistent and real-time across channels? A customer who updates their household profile in the app should not have to re-state it on the phone. A booking made on the website should be visible to the cleaner on their route app. Inconsistency in data across channels is the most common channel orchestration failure — and the most invisible to the teams building the channels, who each see only their own system.
Orchestration (434) — are channels connected so customers can navigate seamlessly between them with no silos? This is the composite test: does the company have a joined-up view of the customer's journey, or does each channel operate as a separate interaction with no shared memory?
Digital, physical, and moment-driven channel design
The channel strategy question is not "should we be digital or physical?" Every customer journey involves both. The question is: which channel serves each moment best?
A purely digital company that ignores physical moments — the cleaner arriving at the door, the unboxing experience, the in-person explanation of a result — misses the touchpoints where trust is built or lost at the highest intensity. Physical moments carry emotional weight that digital channels cannot replicate.
A traditional service business that treats digital as a secondary channel — the website as an online brochure, the email as a support afterthought — loses the pre-purchase research phase entirely. Customers research digitally before they commit physically. Winning the digital research moment is often what determines whether the physical visit ever happens.
The best channel strategies design each moment to use the channel that serves the customer best:
The research moment needs findable, credible digital content
The booking moment needs a frictionless digital transaction
The service delivery moment needs a reliable physical interaction
The result delivery moment needs a clear digital report with optional human follow-up
The renewal moment needs a proactive, low-friction digital prompt
Designing channels from moments is the inversion of the default approach (designing moments around the channels that already exist). The default produces a channel strategy. The inversion produces an orchestrated journey.
Channels in the Marketing Canvas
The canonical question
Can customers interact with your brand through the channels they prefer, with a seamless experience across all of them?
Channels appears in the Vital 8 of two archetypes — in notably different roles:
Secondary Brake for A1 (Disruptive Newcomer): A disruptor's survival depends on being noticed and understood immediately. Features and positioning may be compelling, but if the channels through which the target customer discovers and evaluates the brand are wrong or incomplete, the disruption never reaches beyond the early-adopter bubble. Channel failure for A1 is quiet: the product is ready, the message is sharp, but the distribution infrastructure isn't present where the customers are. A Secondary Brake score means the brake must reach ≥+1 before channel failure begins to limit the reach of the disruption.
Secondary Accelerator for A5 (Pivot Pioneer): A company executing a strategic pivot may find that its existing channels were optimised for the old positioning and the old customer segment. The new direction — new JTBD, new lead segment, new positioning — may require new channels entirely. Legacy channels that served the old strategy are not neutral for the pivot; they actively signal the old identity to customers encountering the brand for the first time in the new context. For A5, channel strategy is part of the repositioning work, not a downstream execution decision.
A note on Fatal Brakes: Channels does not appear as a Fatal Brake in any archetype. But channel failure can block the dimensions that are Fatal. If Acquisition (610) is a Fatal Brake and channel orchestration failures are increasing CAC, the channel problem is a Fatal Brake problem in disguise. If Experience (420) is a Fatal Brake and channel inconsistency is producing the experience variance, the same applies. Channels is the infrastructure. Infrastructure failures propagate upward.
Statements for self-assessment
Rate your agreement on a scale from −3 (completely disagree) to +3 (completely agree). There is no zero — the Marketing Canvas forces a directional position on every dimension.
Note on Detailed Track scoring: if averaging sub-question scores produces a mathematical zero, the method rounds to −1. A split score means the dimension is not clearly helping your goal — and "not clearly helping" requires the same investigation as "hurting."
Interpreting your scores
Negative scores (−1 to −3): Channels operate in silos. Customers who cross channel boundaries encounter a brand that does not recognise them. Orchestration is absent or incomplete. The likely downstream effect: acquisition costs are higher than they need to be (research-to-booking friction), experience scores are lower than designed (channel handoff failures), and engagement data is fragmented (no joined-up view of customer behaviour).
Positive scores (+1 to +3): Channels are orchestrated. Customers move between channels without friction. Data is consistent and real-time across the full journey. Each channel is designed for the specific moment it serves. The company can track the customer journey across touchpoints and improve each channel based on measured performance.
Case study: Green Clean
Green Clean is a fictional eco-friendly residential cleaning service used as the recurring worked example throughout the Marketing Canvas Method. Green Clean sells a residential service — cleaners visit customer homes — not packaged products. Their relevant channels are: website, booking flow, email, in-home service visit, Family Health Report (digital delivery), phone/chat support, and referral mechanics.
Score: −2 to −1 (Weak) Green Clean's channels are independent systems that do not share data or context. The website takes booking requests but is not connected to the cleaner's scheduling app — bookings are manually transferred by the founder. The Family Health Report is generated as a PDF by one team member and emailed by another, introducing a 24–72 hour delay that varies unpredictably. When a customer calls with a question about their report, the support team does not have access to the customer's service history or their specific report data — every call starts from scratch. A customer who books through the website and follows up by email is treated as two separate interactions. No channel knows what the others have communicated. The silos are invisible to the teams but immediately apparent to any customer who crosses a channel boundary.
Score: +1 to +2 (Developing) Green Clean has connected the booking system to the cleaner's route app — scheduling is now automated. The Family Health Report is generated and emailed automatically within 6 hours of service completion. A customer CRM has been introduced: all booking, service, and communication history is accessible to the support team when a customer calls. But the research channel (website) still operates independently — prospects who spend time researching on the website and then book are not identified as the same person until after the booking is made, meaning the website-to-booking conversion cannot be tracked and the research journey cannot be improved with data. The referral mechanic is manual — the team asks existing customers to refer but has no digital system to track referrals or reward them efficiently. Orchestration has improved significantly but is not yet complete.
Score: +2 to +3 (Strong) Green Clean's channels are fully orchestrated around the customer journey, not around internal team structures. The website research behaviour is tracked — customers who read the formula science page before booking convert at a higher rate, so that content is featured prominently in the booking flow. Booking, service, health report, follow-up communication, and subscription renewal are all automated and connected through a single customer record. Support staff see full service history, report data, and communication history before responding to any contact. The referral mechanic is digital — existing customers receive a referral link after every service and can track whether their referrals booked. Channel performance is measured per moment: website conversion rate, booking completion rate, Health Report open rate, support resolution time, referral conversion rate. Each metric corresponds to a specific channel at a specific journey stage. The orchestration is visible in the data: channel handoffs produce no drop-off in conversion that would indicate a silo.
Connected dimensions
Channels does not operate in isolation. Four dimensions connect most directly:
240 — Visual Identity: Channels must carry visual identity consistently. A customer encountering the brand on Instagram, the website, the booking confirmation email, and the physical cleaner's uniform should see a coherent identity at every touchpoint. Channel proliferation without visual governance produces brand fragmentation.
410 — Moments: Channels serve specific moments. The channel strategy is only as good as the moments map underneath it. Without knowing which moments require which types of interaction, channel decisions are made by habit (we've always had a phone line) rather than by design (this moment requires human contact).
420 — Experience: Experience quality depends on channel execution. Channel inconsistency is one of the most common causes of experience variance — customers receive different responses from different channels because the channels are not coordinated. A +2 on Experience requires channel orchestration as a prerequisite.
530 — Media: Media and channels overlap in digital contexts. Paid media, social media, email, and owned content all function as channels at the research and awareness stages. The boundary between Media (530) and Channels (430) is context: Media drives reach and awareness; Channels deliver the interaction and transaction. They share infrastructure and must be planned together.
Conclusion
Channels is the infrastructure dimension of the Journey meta-category. It does not generate the value proposition, design the experience, or create the magic. It delivers all of those things to the customer — or fails to.
The distinction that matters for scoring is not how many channels the brand has. It is whether those channels form a coherent system. A well-orchestrated system of three channels outscores a fragmented system of eight. The customer's perspective is binary: either the journey is seamless across channels, or it is not.
Channel failure is rarely dramatic. It does not produce a single terrible interaction. It produces accumulating friction — the customer who has to re-explain their situation to every channel they touch, the research that doesn't convert because the booking flow is on a different system, the report that arrives three days late because two teams aren't connected. Each incident is minor. The cumulative effect on acquisition, experience, and retention is material.
Sources
Forrester Research, "The State of Omnichannel Commerce", Forrester, 2024 — forrester.com
McKinsey & Company, "The value of getting personalisation right — or wrong — is multiplying", McKinsey, 2021 — mckinsey.com
Marketing Canvas Method, Appendix E — Dimension 430: Channels, Laurent Bouty, 2026
About this dimension
Dimension 430 — Channels is part of the Journey meta-category (400) in the Marketing Canvas Method. The Journey meta-category contains four dimensions: Moments (410), Experience (420), Channels (430), and Magic (440).
The Marketing Canvas Method is a complete marketing strategy framework built around 6 meta-categories, 24 dimensions, and 9 strategic archetypes. Learn more at marketingcanvas.net or in the book Marketing Strategy, Programmed by Laurent Bouty.
Marketing Canvas - Experience
Experience is a Fatal Brake for three archetypes. In every case the mechanism is the same: experience failure is the proximate cause of churn. Dimension 420 of the Marketing Canvas scores consistency — not brilliance — and explains why "leaving nothing to chance" is a scored criterion, not an aspiration.
About the Marketing Canvas Method
This article covers dimension 420 — Experience, part of the
Journey meta-category. The Marketing Canvas Method structures
marketing strategy across 24 dimensions and 9 strategic archetypes.
Full framework reference at
marketingcanvas.net →
·
Get the book →
In a nutshell
Experience (dimension 420) scores the brand's answer to every moment in the customer journey. Where Moments (410) maps what the customer thinks, feels, and does, Experience scores how well the company responds. Does the response reflect the customer's identity? Does it help them achieve their objectives? Is it consistent across time and space? Does it meet the expectations it sets?
The canonical question is not "do we create exceptional experiences?" It is: what is it actually like to be your customer?
In the Marketing Canvas, Experience sits within the Journey meta-category alongside Moments (410), Channels (430), and Magic (440). It is the most frequent Fatal Brake in the method — tied with Positioning (220) and Features (310) at three archetypes each. In every case, the mechanism is the same: experience failure is the proximate cause of churn.
Consistency over brilliance: the canonical insight
The most common Experience scoring error in workshops is confusing it with Magic (440). Experience is not about peak moments or memorable impressions. It is about baseline consistency.
A single brilliant experience surrounded by mediocre ones creates more frustration than consistent adequacy. The customer remembers the gap between the peak and the norm. A hotel that provides an extraordinary check-in and then loses the luggage has not delivered a good experience — it has demonstrated that brilliance is accidental and failure is structural.
Experience design is less about creating memorable highs than about eliminating the lows and ensuring reliability. Every touchpoint should be intentional. Every response should be consistent. The design question is not "how do we create moments that wow?" — that is Magic. The design question is "how do we ensure that every single interaction reflects the promise, regardless of which team member delivers it, which channel it occurs on, or which day of the week it is?"
This is why sub-question 423 scores: "For each moment, your brand answer is consistent in time and space, leaving nothing to chance." Leaving nothing to chance is not a phrase about aspiration. It is a scored criterion. Every undesigned moment is a moment where the brand's promise is undefended — delivered differently by different people, interpreted differently by different teams, experienced differently by different customers.
Score negative if customer experience varies unpredictably across touchpoints, teams, or time. Score positive when experience design is intentional, documented, trained, and measured — and when customers describe the experience using the same words the brand intends.
Experience vs. Magic: the critical distinction
These two dimensions are adjacent and routinely conflated. The confusion produces inflated Experience scores and underinvested Magic strategies.
Experience (420) scores the consistent baseline. Does every customer, in every interaction, receive a response that reflects their identity, serves their goals, and meets the expectations that were set? Consistency is the standard. A score of +2 on Experience means: every moment has a designed response, that response is reliably delivered, and customers confirm it matches their expectations.
Magic (440) scores the peaks. Does the brand exceed expectations in ways customers didn't anticipate? Magic is the surprise that converts a satisfied customer into an advocate. It is scored separately because it requires a different design discipline — not reliability engineering but expectation mapping and strategic over-delivery.
The sequencing principle: fix Experience before investing in Magic. A brand with a −1 on Experience that invests in Magic initiatives is adding peaks to an unreliable baseline. Customers who encounter magic in one interaction and inconsistency in the next do not become advocates. They become confused — and confusion is the precursor to churn.
B2B Experience: the seams are felt
In B2C, Experience failure is visible and dramatic: the wrong product delivered, the rude support call, the website that crashes at checkout. In B2B, Experience failure is quieter and more expensive.
NTT Data's Experience challenge was not a single bad project. It was organisational inconsistency across post-merger engagement models. Different teams, acquired through different M&A paths, delivering different service standards under the same brand name. The client could feel the seams — the inconsistency between what the sales team promised and what the delivery team delivered, between what one regional office did and what another understood the engagement model to be.
B2B clients do not churn after one bad interaction. They churn after accumulating evidence that the inconsistency is structural rather than situational. The moment a client forms the belief "this isn't a bad week, this is how they operate" — the renewal conversation has already been lost. The revenue metric confirms it six months later.
For B2B service businesses, Experience design means: what does a client encounter at every stage of the engagement, regardless of which team member they are talking to? The standard is not the best delivery manager on staff. It is the minimum consistent standard that can be trained, documented, and reliably reproduced.
Experience in the Marketing Canvas
The canonical question
What is it actually like to be your customer?
Experience is a Fatal Brake for three archetypes — the most Fatal Brake appearances of any single dimension alongside Positioning and Features:
Fatal Brake for A4 (Stagnant Leader): Experience failure is the proximate cause of stagnation. The canonical A4 pattern: churn rises, leadership reaches for Acquisition to refill the bucket. The method says fix the leak first. For Sage in 2019, fragmented UX across dozens of legacy SKUs and desktop-era screens was driving customers to Xero and QuickBooks before the retention team even knew they were at risk. No acquisition investment can compensate for an experience that is actively driving customers away. Experience must reach ≥+2 before any other A4 investment makes strategic sense.
Fatal Brake for A6 (Value Harvester): A company extracting maximum cash flow from an existing base depends entirely on retention. Every 1% of churn that Experience failure generates is a permanent reduction in the cash extraction potential. For A6, Experience is not a growth lever — it is a defensive necessity. The floor below which the strategy collapses.
Fatal Brake for A7 (Scale-Up Guardian): Hypergrowth destroys experience consistency. Teams grow faster than onboarding can standardise behaviour. Processes built for 50 customers break at 500. The individual attention that defined early relationships becomes structurally impossible at scale. The Scale-Up Guardian's primary Experience challenge is not improving the experience — it is preserving the experience as headcount and customer volume compound. Every month of growth without experience governance is a month of promise dilution.
Secondary Brake for A2 (Efficiency Machine): For the Efficiency Machine, Experience operates at the operational level. Magic (440) is the adjacent dimension that eliminates friction entirely; Experience sets the floor below which efficiency becomes indistinguishable from indifference. A cost-leader that delivers a genuinely frictionless experience retains customers. A cost-leader that delivers a degraded experience loses them to whichever competitor can match the price with marginally better service.
Statements for self-assessment
Rate your agreement on a scale from −3 (completely disagree) to +3 (completely agree). There is no zero — the Marketing Canvas forces a directional position on every dimension.
Note on Detailed Track scoring: if averaging sub-question scores produces a mathematical zero, the method rounds to −1. A split score means the dimension is not clearly helping your goal — and "not clearly helping" requires the same investigation as "hurting."
Interpreting your scores
Negative scores (−1 to −3): Experience varies unpredictably across touchpoints, teams, or time. The brand promise is undefended in at least some interactions. For archetypes where Experience is a Fatal Brake, this score explains why churn is rising and retention investment is not working. The leaky bucket cannot be fixed by adding more acquisition — it must be fixed at the experience level first.
Positive scores (+1 to +3): Experience is intentional, documented, trained, and measured. Every moment has a designed response. Customers describe the experience in consistent language that matches the brand's intended positioning. The baseline is reliable. Magic (440) initiatives can now be layered on top of a consistent foundation rather than compensating for an inconsistent one.
Case study: Green Clean
Green Clean is a fictional eco-friendly residential cleaning service used as the recurring worked example throughout the Marketing Canvas Method.
Score: −2 to −1 (Weak) Green Clean's experience varies significantly by team member and visit. The two full-time cleaners operate consistently. The three part-time contractors, hired during a growth period, have had no structured onboarding and no shared standard for what a Green Clean visit should look and feel like. Some customers receive a verbal explanation of the formula used; others do not. Some receive the Family Health Report within 24 hours; others wait three days or receive it after a follow-up request. When a customer calls to ask about an ingredient, the response depends on which team member picks up. The experience is sometimes excellent and frequently adequate — but it is never reliably consistent. When the founder asks customers how the experience compares to EcoPure, the feedback is mixed: "better sometimes, comparable usually." That is a −1: experience is not reliably reflecting the positioning.
Score: +1 to +2 (Developing) Green Clean has identified the three highest-variance touchpoints from customer research: the onboarding call, the first-service visit, and the Family Health Report delivery. For each, a standard has been designed and documented. Contractors are trained on the first-service protocol. The Health Report is now automated — delivered within 6 hours of every service completion without requiring manual action. The onboarding call has a structured agenda that ensures the health-first positioning is explained consistently regardless of who conducts it. Variance has reduced but not eliminated — the support interaction (what happens when a customer reports a concern) remains undesigned and inconsistent. Positive customer descriptions of the experience are converging on consistent language: "professional," "trustworthy," "actually explains what they're doing." The experience baseline is improving. It is not yet reliable enough to score +2.
Score: +2 to +3 (Strong) Every Green Clean customer touchpoint has a designed response, documented standard, and trained delivery. The experience is consistent whether the customer is in their first month or their third year, whether they call on a Monday or a Saturday, whether their regular cleaner is available or a substitute is deployed. When a substitute is required, the customer receives a proactive message explaining the change and confirming the substitute has been briefed on the household profile. Support interactions follow a structured resolution protocol — concern acknowledged within 2 hours, resolution proposed within 24 hours, follow-up confirmed within 48 hours. Customer descriptions of the experience use consistent language unprompted: "they always explain what they've done," "I never have to chase anything," "it's the same standard every time." The NPS promoter cohort grew from 38% to 62% between 2021 and 2024 — a direct consequence of experience consistency, not product change.
Connected dimensions
Experience does not operate in isolation. Four dimensions connect most directly:
410 — Moments: Experience responds to moments. Every Experience initiative traces back to a specific mapped moment where the current response is inadequate. Without a complete Moments map, Experience improvements are directional guesses — improving the wrong touchpoints while leaving the highest-variance ones unaddressed.
130 — Pains & Gains: Experience design eliminates pains. The specific pains identified in journey research — the ones that accumulate into churn — are the Experience design brief. A pain at the research phase is an Experience problem in the before stage. A pain at the support interaction is an Experience problem in the after stage.
440 — Magic: Magic elevates experience beyond consistency. Once the baseline is reliable, Magic creates the peaks that generate advocacy. The sequencing is fixed: fix Experience first, then invest in Magic. A +2 on Experience is the prerequisite for Magic initiatives to work as intended.
630 — Lifetime: Experience quality predicts customer lifetime. The most reliable predictor of whether a customer will still be a customer in 12 months is whether their ongoing experience is consistently meeting the promise. Experience is not just a satisfaction metric — it is the leading indicator of lifetime value.
Conclusion
Experience is tied as the most frequent Fatal Brake in the Marketing Canvas Method for a straightforward reason: it is the dimension that most directly connects to churn. Customers do not leave because of a single terrible interaction. They leave because the cumulative experience does not consistently reflect the promise that acquired them.
The strategic diagnostic is not "how good is our best experience?" — teams consistently overrate on this question because they remember peaks and discount inconsistency. The question is: "what does every customer encounter, every time, regardless of team member, channel, or day of the week?"
If the honest answer is "it depends" — dimension 420 is the initiative queue.
Sources
Matt Watkinson, The Ten Principles Behind Great Customer Experiences, FT Publishing, 2013
Bain & Company, "Closing the Delivery Gap", 2005 — bain.com (the foundational 80/8 gap research: 80% of companies believe they deliver a superior experience; 8% of customers agree)
Marketing Canvas Method, Appendix E — Dimension 420: Experience, Laurent Bouty, 2026
About this dimension
Dimension 420 — Experience is part of the Journey meta-category (400) in the Marketing Canvas Method. The Journey meta-category contains four dimensions: Moments (410), Experience (420), Channels (430), and Magic (440).
The Marketing Canvas Method is a complete marketing strategy framework built around 6 meta-categories, 24 dimensions, and 9 strategic archetypes. Learn more at marketingcanvas.net or in the book Marketing Strategy, Programmed by Laurent Bouty.
Marketing Canvas - Moments
Most companies over-invest in the "during" phase of the customer journey and under-invest in "before" and "after" — which is precisely where both acquisition and retention are won or lost. Dimension 410 of the Marketing Canvas explains how to map moments correctly, and why the most valuable output is the seams it reveals between departments.
About the Marketing Canvas Method
This article covers dimension 410 — Moments, part of the
Journey meta-category. The Marketing Canvas Method structures
marketing strategy across 24 dimensions and 9 strategic archetypes.
Full framework reference at
marketingcanvas.net →
·
Get the book →
In a nutshell
Moments (dimension 410) maps the complete customer journey as a sequence of interactions seen through the customer's eyes. For each moment — before, during, and after purchase — three questions: what does the customer think? What do they feel? What do they do?
The discipline that makes this strategic rather than descriptive: moments must be built from customer observations and interviews, not from internal assumptions about how the journey should work. Every organisation believes it knows its customer journey. The map built from actual customer research almost always looks different from the one built internally.
In the Marketing Canvas, Moments sits within the Journey meta-category alongside Experience (420), Channels (430), and Magic (440). It is the discovery layer — the research input that makes every other Journey dimension scoreable with evidence rather than assumption.
The seams between departments
The most powerful diagnostic purpose of Moments mapping is one that most companies never anticipate: it reveals the seams between internal departments, and those seams are where the customer experience fails.
Marketing owns "before" — awareness, research, consideration. Sales owns "during" — the purchase conversation, onboarding, first use. Support owns "after" — ongoing use, queries, renewal, advocacy. Each team does their part reasonably well, measured on their own terms.
But the customer experiences one continuous journey.
When a customer moves from "before" to "during" — from the website to the first sales conversation — they often encounter a brand that seems to know nothing about what they read, what concerns they formed, or what decision criteria they brought to that conversation. The seam is visible to the customer; it is invisible to the organisation because no single team owns the transition.
Moments mapping forces the organisation to adopt the customer's timeline rather than its own. When the full map is laid out — every touchpoint from first awareness to advocacy, with what the customer thinks, feels, and does at each stage — the seams appear as blank spaces or contradictory experiences. Those gaps are the strategic agenda.
Score negative if the journey map was built from internal assumptions or if the "after purchase" phase is unmapped. Score positive when moments are customer-researched, granular, and actively used to design specific touchpoints.
Where companies systematically fail: the "during" trap
Most companies over-invest in the "during" phase of the journey — the purchase moment, onboarding, first use — and under-invest in "before" and "after." This is where both acquisition and retention are won or lost, making the imbalance strategically costly.
Before purchase is where acquisition happens or fails. A customer who feels confused during research — overwhelmed by competing eco-friendly claims, unable to find independent verification, uncertain which product fits their specific situation — will not convert, regardless of how good the product is. The pre-purchase experience is entirely within the brand's control, and almost entirely unmapped by most organisations. The website, the content, the comparison experience, the social proof — these are designed by teams who know the product, not by teams who have watched confused prospects try to make a decision.
After purchase is where retention happens or fails. A customer who feels abandoned after the transaction — no structured follow-up, no proactive communication about what to expect, no mechanism to give feedback — begins the churn journey immediately. Engagement does not decline suddenly. It begins its decline at the first moment the customer feels the relationship ended at the point of purchase.
The diagnostic test: map your last twelve months of customer-facing initiatives. What percentage addressed the before phase? The during phase? The after phase? The imbalance is almost always striking — and it predicts where the strategic gaps are before a single score is calculated.
Mental Models - Moments in the Marketing Canvas
The three questions at every moment
For each moment in the journey, the Marketing Canvas requires three specific answers — all drawn from customer research, not internal assumption:
What does the customer think? The cognitive content of the moment. What information are they processing? What comparisons are they making? What questions are unanswered? What beliefs — accurate or not — are shaping their interpretation of this interaction? For Green Clean's "first service visit" moment: "I hope this is genuinely different from the eco-cleaning service I tried before. I want to see something that proves the health claim."
What does the customer feel? The emotional state at this moment. Anxiety, anticipation, confusion, trust, pride, disappointment. This is not the emotional job (what they want to feel in their lives) — it is the actual emotional state at this specific interaction. Accurately mapping current feelings is the prerequisite for designing better ones. If the customer feels sceptical at the booking stage, no amount of warm onboarding email copy will resolve it.
What does the customer do? The observable behaviour. Searches. Clicks. Calls. Compares. Reads reviews. Asks a friend. Abandons the checkout. These actions are often more revealing than stated opinions because they reflect actual behaviour under actual conditions, not hypothetical responses to survey questions.
Moments in the Marketing Canvas
The canonical question
Have you identified the critical touchpoints where customers interact with your brand, and do you understand what they think, feel, and do at each one?
Strategic role: foundational for most, existential for one
Moments has an unusual Vital 8 profile — it appears formally in only one archetype: it is a Secondary Brake for A9 (Category Creator).
The reason is specific: in a new category, the customer journey doesn't exist yet. There are no established research behaviours, no familiar comparison frameworks, no prior experience of the product category that shapes customer expectations. Every moment must be designed from scratch — the customer has no mental model to bring to the first interaction. Green Clean in 2021 could not assume customers knew how to evaluate "indoor health protection" because the category had not been defined. The first-clean teaching moment — the onboarding experience that explained what health-first meant in practice — was not a nice-to-have. It was the foundational category education that made everything downstream possible.
For all other archetypes, Moments functions like Pains & Gains (130): it is a research input that feeds the scored dimensions above it, particularly Experience (420) and Channels (430). A company that cannot score Experience honestly — because it does not know what customers actually experience at each touchpoint — almost certainly has an unmapped or assumption-built Moments layer underneath. Improving the Moments map improves the reliability of every Journey dimension score.
Statements for self-assessment
Rate your agreement on a scale from −3 (completely disagree) to +3 (completely agree). There is no zero — the Marketing Canvas forces a directional position on every dimension.
Note on Detailed Track scoring: if averaging sub-question scores produces a mathematical zero, the method rounds to −1. A split score means the dimension is not clearly helping your goal — and "not clearly helping" requires the same investigation as "hurting."
Interpreting your scores
Negative scores (−1 to −3): The journey map is absent or built from internal assumptions rather than customer research. The before and/or after phases are unmapped. The seams between departments are invisible because nobody owns the transitions. Experience (420), Channels (430), and Magic (440) scores cannot be reliably set because the evidence base doesn't exist.
Positive scores (+1 to +3): The journey map is built from customer research, covers all three phases, captures think/feel/do at each moment, and actively identifies where seams between departments are creating experience failures. The map is used — it feeds Experience design, Channels decisions, and Magic moment identification — rather than filed as a project deliverable.
Case study: Green Clean
Green Clean is a fictional eco-friendly residential cleaning service used as the recurring worked example throughout the Marketing Canvas Method.
Score: −2 to −1 (Weak) Green Clean's journey map was assembled by the founding team in a two-hour internal session. It covers the booking process (during) and a brief post-service survey (after). The before phase is entirely unmapped: no research has been done on how health-conscious parents discover cleaning services, what search terms they use, which comparison triggers they apply, or what objections form during the research phase. The after phase map stops at the thank-you email. No moment beyond the first three months of service has been researched. When the team describes the customer journey, they describe what they intended to build, not what customers actually experience. The seam between the website (marketing) and the first sales conversation (founder-led) is the most visible gap — customers arrive with questions formed during research that the founder does not know they have.
Score: +1 to +2 (Developing) Green Clean has conducted eight customer interviews specifically focused on journey mapping. The before phase now has three defined moments: the initial search ("what is the difference between eco-cleaning and health-first cleaning?"), the comparison visit (landing on the Green Clean website and trying to find independent validation), and the booking decision (the moment of commitment and what makes it happen or not). For each, the team has documented what customers think, feel, and do based on interview evidence rather than assumption. The during and early-after phases are mapped. The seam between website and onboarding call has been identified — customers arrive uncertain whether the health claim is substantiated. The team has not yet designed a solution to the seam. But the seam is now named.
Score: +2 to +3 (Strong) Green Clean's journey map covers all phases, built from twenty-two customer interviews and three observed service visits. The before phase is mapped in five moments, each with specific documented think/feel/do data. The seam between website and first contact has been designed out: a structured pre-booking sequence sends the university formula summary and B-Corp certification to every prospect before the first call, so the call begins with the health claim validated rather than questioned. The "First-Clean Teaching Moment" — a structured onboarding experience at the first service visit — explains in plain language what health-first means in practice, shows the before/after air quality data, and delivers the first Family Health Report within 24 hours. The after phase is mapped through the 12-month relationship, with specific moments designed at months 1, 3, 6, and 12 that correspond to the highest churn risk periods identified through customer research. The journey map is reviewed quarterly and updated as research produces new evidence.
Connected dimensions
Moments does not operate in isolation. Four dimensions connect directly as the downstream beneficiaries of good journey mapping:
130 — Pains & Gains: Pains and gains map to specific moments. The pain of "I can't find independent verification" belongs to the before-phase research moment. The gain of "the Family Health Report made me feel like I finally know the truth" belongs to the first-service after moment. Without Moments mapping, Pains & Gains is a list. With it, it becomes a journey-anchored strategy.
420 — Experience: Experience is designed moment by moment. Every Experience initiative traces back to a specific moment in the journey where the current response is inadequate. Without a complete Moments map, Experience improvements are based on internal opinion rather than evidence about where the customer actually struggles.
430 — Channels: Channels serve specific moments. The question "which channels should we be present on?" cannot be answered without knowing which moments require which types of interaction. A customer in the research moment needs findable, credible content. A customer in the post-service moment needs a proactive, low-friction feedback mechanism. The channel follows the moment.
440 — Magic: Magic happens at peak moments. The unexpected delight that converts a satisfied customer into an active advocate occurs at a specific moment in the journey — often one that companies hadn't designed for at all. Without a complete Moments map, Magic cannot be placed. The map reveals where the peaks and troughs are; Magic strategy addresses the peaks.
Conclusion
Moments is the dimension that makes the Journey meta-category honest. Without it, Experience is opinion, Channels is habit, and Magic is accident.
The strategic value is not the map itself — it is what the map reveals. The over-investment in "during" at the expense of "before" and "after." The seams between marketing, sales, and support that the customer feels as a fragmented experience. The moments that are assumed to be satisfactory because nobody has actually asked a customer what they think, feel, and do at that point.
For Category Creators building a journey from scratch, the Moments map is the architectural blueprint — without it, every other Journey dimension is being built without knowing the structure it needs to serve. For all other archetypes, it is the evidence base that makes every Journey dimension score credible rather than flattering.
Sources
Chip Heath, Dan Heath, The Power of Moments: Why Certain Experiences Have Extraordinary Impact, Simon & Schuster, 2017
Forrester Research, "Customer Journey Mapping Best Practices", Forrester, 2024 — forrester.com
Marketing Canvas Method, Appendix E — Dimension 410: Moments, Laurent Bouty, 2026
About this dimension
Dimension 410 — Moments is part of the Journey meta-category (400) in the Marketing Canvas Method. The Journey meta-category contains four dimensions: Moments (410), Experience (420), Channels (430), and Magic (440).
The Marketing Canvas Method is a complete marketing strategy framework built around 6 meta-categories, 24 dimensions, and 9 strategic archetypes. Learn more at marketingcanvas.net or in the book Marketing Strategy, Programmed by Laurent Bouty.
Marketing Canvas - Proof
Every brand makes claims. Few build proof systems. Dimension 340 of the Marketing Canvas identifies four types of proof — demonstration, logical explanation, endorsement, and reputation — and explains why stacking all four is the only way to convert sceptical prospects into convinced ones.
About the Marketing Canvas Method
This article covers dimension 340 — Proof, part of the
Value Proposition meta-category. The Marketing Canvas Method structures
marketing strategy across 24 dimensions and 9 strategic archetypes.
Full framework reference at
marketingcanvas.net →
·
Get the book →
In a nutshell
Proof (dimension 340) scores the evidence layer of your value proposition — the demonstrations, endorsements, explanations, and reputation markers that make your claims credible. The foundational distinction: proofs are not the same as claims.
Saying "we're the best eco-friendly cleaning service in the city" is a claim. Showing a customer saying "they changed how I think about what clean actually means" is proof. The dimension scores whether evidence exists and whether it is deployed effectively — not whether the brand believes its own story.
In the Marketing Canvas, Proof sits within the Value Proposition meta-category alongside Features (310), Emotions (320), and Prices (330). It is the credibility layer that makes everything else believable: Features describe what the product does; Proof demonstrates it.
Claims vs. proof: the foundational distinction
Every brand makes claims. Few build proof systems.
A claim is a statement the brand makes about itself. Proof is evidence that exists independently of the brand's desire to be believed. The gap between them is the gap between what a brand says and what a prospect believes — and in most markets, that gap is large and widening.
The reason: customers have become systematically sceptical of self-assertion, particularly around sustainability, quality, and expertise claims. "Award-winning," "industry-leading," "eco-friendly," "best-in-class" — these phrases have been used so frequently, by brands of such varying quality, that they carry almost no credibility signal. They are the background noise of value proposition communication.
What breaks through is evidence that exists independently of the brand making the claim: a third party that validated it, a customer who confirmed it, a before/after result that demonstrated it, a mechanism that explains how it works. That is proof. And the dimension that scores whether your value proposition has it is 340.
Score negative if claims are unsupported or if proof relies entirely on self-assertion. Score positive when multiple proof types reinforce each other and customers cite specific evidence when recommending the brand.
The four canonical proof types
The Marketing Canvas identifies four types of proof. The most effective strategies use all four — each type covers a different dimension of credibility, and they stack:
Demonstration — showing the product working in a real context. Not a polished commercial. A before/after air quality result. A live installation. A customer tour. A product in use under realistic conditions. Demonstration answers "does it actually work?" It is the most visceral form of proof because it bypasses scepticism about the brand's motives — the outcome is visible.
Logical explanation — clarifying how and why it works. The mechanism. Why is this formula non-toxic? Because it uses X chemistry instead of Y. How does it eliminate toxins? Here is the molecular process. Why does this hold up better than alternatives? Here is the engineering rationale. Logical explanation answers "can I understand why it works?" It converts the sceptical-but-open prospect — the one who wants to believe but needs a reason — into a convinced one.
Endorsement — third-party validation. Certifications, awards, analyst recognition, celebrity ambassadors, peer recommendations. In B2C: certifications like B-Corp or EcoCert, customer reviews, media coverage, social proof numbers ("550 families served"). In B2B: Gartner Magic Quadrant placement, ISO certifications, named client case studies, analyst endorsements. Endorsement answers "who else believes this?" It transfers credibility from a trusted external source to the brand.
Reputation — established credibility that precedes any specific claim. Years in business. Volume of customers served. Industry recognition over time. The credibility that arrives before a prospect reads a single word of marketing. Reputation answers "can I trust this brand in general?" It is the slowest proof type to build and the most durable once established.
Stacking: why one proof type is never enough
Each proof type addresses a different dimension of credibility. A single proof type is credible on one dimension and silent on the others — leaving gaps a sceptical prospect will fill with doubt.
A brand that has only endorsement (certified, award-winning) but no demonstration (show me it works) can be dismissed as buying certifications. A brand with strong demonstration but no logical explanation raises the question "yes, but how?" A brand with deep reputation but no current endorsement is vulnerable to the claim that past performance is no longer relevant.
The proof stack that makes a category claim genuinely credible combines all four:
Here is what it does (demonstration)
Here is why it works (logical explanation)
Here is who else validates it (endorsement)
Here is the track record behind us (reputation)
For Green Clean as an A9 Category Creator — a company asking the market to believe in a category that didn't previously exist — the stacking principle is existential. The burden of proof for creating a new category is ten times higher than for competing within one. Every claim they make is unfamiliar. Every endorsement they earn legitimises the category, not just the company. Every demonstration they run teaches the market that the job is real.
Laurent Bouty - Marketing Canvas Method - Proofs
B2B and B2C: proof types work differently
The four proof types apply universally but manifest differently by context.
In B2B, proof often determines whether you make the shortlist before any sales conversation begins. Gartner Magic Quadrant placement, ISO certifications, named client case studies with verifiable outcomes, and analyst endorsements function as purchase prerequisites — the deal never begins without them. A B2B buyer who cannot show their CFO a Gartner ranking or a named enterprise reference cannot internally justify the purchase, regardless of the product's quality. Proof here is a gatekeeping mechanism, not just a persuasion tool.
In B2C, proof works through different channels. Customer reviews (demonstration by proxy), before/after results (direct demonstration), media coverage (earned endorsement), social proof numbers ("over 1 million families have switched"), and visible certifications on packaging all contribute to the credibility system. The scale of endorsement matters differently: a single enterprise case study moves a B2B deal; 500 five-star reviews move a B2C conversion. The mechanism is the same — independent validation — but the format and threshold differ.
The implication for scoring: a B2B company that scores its proof stack against B2C norms (focusing on reviews and social media rather than analyst coverage and certifications) will systematically misdiagnose the dimension.
Proof in the Marketing Canvas
The canonical question
Why should customers believe your claims?
Proof appears in the Vital 8 of four archetypes — spanning a wide range of strategic urgency:
Primary Accelerator for A8 (Niche Expert): Expert authority must be demonstrable, not claimed. A niche expert whose expertise cannot be independently verified is simply a specialist with good self-confidence. The proof stack — certifications, published work, client outcomes, peer recognition — is the mechanism that converts internal confidence into external authority. For A8, Proof is the dimension that transforms "we know this space deeply" into "the market knows we know this space deeply." Hermès' resale values (Birkin bags appreciating faster than gold) are a form of proof: independent market validation that the quality claim is real.
Secondary Brake for A3 (Brand Evangelist): Tribal trust is built on values and shared belief — but it is sustained by proof that the brand lives what it claims. Patagonia's "Don't Buy This Jacket" campaign worked because the proof of environmental commitment was already established through decade of verified actions: 1% for the Planet donations (independently tracked), Worn Wear repairs data (published), B-Corp certification (audited). Without the proof stack underneath, the campaign would have been dismissed as marketing theatre. For A3, credibility gaps erode tribal trust faster than any competitive threat.
Secondary Brake for A4 (Stagnant Leader): A stagnant leader's most valuable asset is the credibility accumulated over years of market presence. When that credibility starts to decay — when proof points become dated, when case studies reference old products, when certifications lapse — the legacy position that was the primary competitive defence begins to dissolve. Proof maintenance is as important as proof creation for A4.
Secondary Brake for A9 (Category Creator): The unique challenge here is proving something works in a category that doesn't exist yet. Green Clean cannot reference ten years of "health-first home care" competitors because the category is new. Every proof point they build — the university formula validation, the B-Corp certification, the Family Health Report, the air quality before/after results — is simultaneously proving the company and defining the standards of the category. For A9, Proof is the physical evidence that the new category is real, not just a repositioning exercise.
Statements for self-assessment
Rate your agreement on a scale from −3 (completely disagree) to +3 (completely agree). There is no zero — the Marketing Canvas forces a directional position on every dimension.
Note on Detailed Track scoring: if averaging sub-question scores produces a mathematical zero, the method rounds to −1. A split score means the dimension is not clearly helping your goal — and "not clearly helping" requires the same investigation as "hurting."
Interpreting your scores
Negative scores (−1 to −3): Claims are unsupported or rely entirely on self-assertion. Proof types are absent or single-layer. Sceptical prospects — particularly in categories where greenwashing is common — have no independent reason to believe the value proposition. Conversion rates are lower than the product quality justifies. For archetypes where Proof is a Strategic Brake, a negative score here explains why the strategy is not generating the expected traction.
Positive scores (+1 to +3): Multiple proof types reinforce each other. Demonstration, explanation, endorsement, and reputation are all present and deployed at the moments in the customer journey where scepticism is highest. Customers cite specific evidence when recommending the brand — not because they were asked to, but because the proof is memorable and specific enough to pass on.
Case study: Green Clean
Green Clean is a fictional eco-friendly residential cleaning service used as the recurring worked example throughout the Marketing Canvas Method.
Score: −2 to −1 (Weak) Green Clean's proof system is entirely self-asserted. The website states "non-toxic cleaning you can trust" and "safe for your family." No demonstration: no before/after air quality data, no ingredient testing results, no customer outcome evidence. No logical explanation: the website says the formula is "plant-based" but does not explain what that means for toxin elimination or why it is safer than conventional products. No endorsement: no certifications, no third-party validation, no named customer testimonials. No reputation: Green Clean is four years old and has not systematically built a credibility track record. When health-conscious parents research the brand, they find claims that every competitor also makes. There is nothing that distinguishes a Green Clean claim from an EcoPure claim from a NatureFresh claim. The proof gap is the primary barrier to conversion for the Early Believer segment — the very customers who care most about evidence.
Score: +1 to +2 (Developing) Green Clean has begun building a proof stack. The B-Corp certification (first in the region for cleaning services) is the strongest endorsement they have — it is independently audited and competitively rare. The university partnership behind the formula is publicly referenced but not yet explained: the website says "developed with a university chemistry department" without specifying the institution, the testing methodology, or what the validation showed. Customer testimonials are present but anonymous — "a satisfied parent in [city]" — which reduces their credibility impact. The Family Health Report exists and provides per-visit demonstration data but is only seen by existing customers, not by prospects during the research phase. The proof stack is forming but is not yet deployed at the moments that matter most: the first three minutes of a prospect's research.
Score: +2 to +3 (Strong) Green Clean's proof stack covers all four types and is deployed at the right journey stages. Demonstration: the Family Health Report excerpt (average toxin load reduction across 550 customer visits) is visible on the website homepage before any sales conversation. A before/after air quality result from a real customer home (anonymised but with verifiable methodology) appears on the booking page. Logical explanation: a plain-language technical summary explains precisely why the university-validated formula eliminates specific chemical classes that conventional eco-cleaning products do not address. Endorsement: B-Corp certification displayed prominently; EcoCert certification in process; 127 named customer testimonials with full first name and suburb; local health journalist coverage. Reputation: four years of service data, 550 active customers, 35% referral rate cited explicitly as a trust signal. When a prospect asks "why should I believe you over EcoPure?" — the answer is specific, layered, and independently verifiable at every level.
Connected dimensions
Proof does not operate in isolation. Four dimensions connect most directly:
310 — Features: Proofs demonstrate features work. The unique feature (the university-validated formula) is only as strong as the evidence behind it. Without the proof, the formula is a claim like every competitor's. With the proof, it is a category-defining differentiator.
330 — Prices: Proofs justify premium pricing. A customer who has encountered the full proof stack — demonstration data, logical explanation, B-Corp endorsement, reputation track record — is less price-sensitive than one who has not. Proof shifts perceived value upward and expands the WTP range.
520 — Stories: Stories are the delivery vehicle for proof. A case study is a story with demonstration. A customer testimonial is a story with endorsement. A founder origin narrative is a story with reputation. Proof is the evidence; Stories (520) is the format that makes evidence compelling and memorable.
530 — Media: Earned media is a form of proof. A journalist covering Green Clean's health-first positioning in a local parenting publication is providing endorsement at scale — more credible than any paid placement because the editorial decision is independent. Media strategy and proof strategy should be planned together.
Conclusion
The gap between a brand that has good features and a brand that is believed to have good features is exactly the width of dimension 340.
The most capable product in the market cannot sell itself if prospective customers have no independent reason to trust the claims made about it. Every market has category-level scepticism built up by years of overclaimed marketing — "eco-friendly," "expert," "world-class" — that has trained buyers to discount self-assertion reflexively.
The proof stack is the mechanism that breaks through that scepticism. Demonstration shows. Explanation clarifies. Endorsement validates. Reputation precedes. Together, they convert claims into credibility — and credibility into the willingness to buy, recommend, and pay a premium.
Sources
Robert Cialdini, Influence: The Psychology of Persuasion, Harper Business, revised edition 2021
Nielsen, Trust in Advertising, Nielsen Consumer Research, 2023 — nielsen.com
Marketing Canvas Method, Appendix E — Dimension 340: Proof, Laurent Bouty, 2026
About this dimension
Dimension 340 — Proof is part of the Value Proposition meta-category (300) in the Marketing Canvas Method. The Value Proposition meta-category contains four dimensions: Features (310), Emotions (320), Prices (330), and Proof (340).
The Marketing Canvas Method is a complete marketing strategy framework built around 6 meta-categories, 24 dimensions, and 9 strategic archetypes. Learn more at marketingcanvas.net or in the book Marketing Strategy, Programmed by Laurent Bouty.
Marketing Canvas - Pricing
Pricing errors run in both directions. Underpricing signals low quality and leaves margin on the table. Overpricing creates resentment no feature list can fix. Dimension 330 of the Marketing Canvas scores whether your pricing actively supports your positioning — or quietly contradicts it.
About the Marketing Canvas Method
This article covers dimension 330 — Pricing, part of the
Value Proposition meta-category. The Marketing Canvas Method structures
marketing strategy across 24 dimensions and 9 strategic archetypes.
Full framework reference at
marketingcanvas.net →
·
Get the book →
In a nutshell
Prices (dimension 330) scores whether your pricing strategy reflects the value you deliver, aligns with customer willingness to pay, and supports your positioning. The foundational question is not "is the price low?" It is: does the customer perceive more value than the price asks, relative to alternatives?
That reframing is the entire point of treating pricing as a strategic dimension rather than a finance function. Price is not just a revenue variable — it is a signal. It communicates quality, confirms positioning, and either reinforces or contradicts everything else in the value proposition.
In the Marketing Canvas, Prices sits within the Value Proposition meta-category alongside Features (310), Emotions (320), and Proof (340). It is the dimension that makes the value proposition credible or exposes it as overclaimed.
Pricing errors run in both directions
The most common framing of a pricing problem is "our price is too high." The canonical view is more demanding: pricing errors run symmetrically in both directions, and both are strategically damaging.
Overpricing creates a gap between perceived value and cost that even strong features cannot bridge. When price exceeds what customers perceive as justified by the value, the result is not premium positioning — it is resentment, abandoned trials, and word-of-mouth that damages rather than builds.
Underpricing is equally problematic and more often overlooked. A price that is too low signals low quality and leaves margin on the table. It undermines positioning — a brand that claims "indoor health protection" at commodity pricing sends a contradictory signal. Customers use price as a quality heuristic. A low price says: "we don't fully believe in what we built either."
The diagnostic question is not where the price sits in absolute terms. It is whether the customer perceives more value than the price asks, compared to every alternative they are considering. A €15 artisanal coffee is not expensive if the customer perceives it as worth €20. A €5 coffee is overpriced if the customer sees it as worth €3.
Score negative if pricing is set by finance without customer input, or if there is a disconnect between price and positioning. Score positive when pricing actively supports the strategic position and customers perceive fair value — not cheap, not resentment-inducing, but justified.
The price/positioning test
The sharpest diagnostic in dimension 330 is also the simplest:
A premium position with discount pricing creates cognitive dissonance. A value position with premium pricing creates resentment. The price must match the promise.
This test catches misalignments that are obvious once named but invisible in day-to-day operations. A B2B software company that positions itself as "enterprise-grade" but prices below mid-market confuses the procurement team — the price contradicts the claim. A cleaning service that positions itself as health-protection specialists but prices below the eco-follower in the market undermines its own differentiation before a customer conversation begins.
Run the test against your own positioning: if a prospect saw only your price — before any marketing, any features list, any proof — would the price itself reinforce or contradict your positioning? If it contradicts, dimension 330 requires attention regardless of what the rest of the value proposition delivers.
M8 and dimension 330: diagnosis vs. strategy
In the Marketing Canvas Method, pricing is measured twice — at different points in the process, for different purposes.
M8 (Perceived Price) is calculated in Step 1 (Strategic Context Mapping). It normalises your actual price per unit relative to the highest and lowest prices in your competitive set, producing a score from −12 (feels very cheap) to +12 (feels very expensive). M8 is the diagnosis: it shows where your brand sits on the customer's mental price scale before any strategic decisions are made.
Dimension 330 is scored in Step 3 (the Vital Audit). It scores whether your pricing strategy — how you set, communicate, and manage price — actively serves your Step 2 goal. M8 is the starting position. Dimension 330 is the question: are you managing it intentionally?
For Green Clean, M8 is +3.0 — slightly above mid-market, well below EcoPure at +12.0. That is a deliberate positioning choice: accessible enough to attract health-conscious families who cannot justify the premium leader, differentiated enough that "eco-follower" NatureFresh at −6.0 cannot compete on the same terms. Dimension 330 scores whether Green Clean has made that a strategic choice — informed by customer WTP research, aligned with their health-first positioning, and sustainable relative to their cost structure — or whether +3.0 is simply where they ended up.
The four pricing anchors
The Marketing Canvas scores dimension 330 against four sub-questions that together define whether pricing is strategic or accidental:
Value vs. alternatives (331): Does the customer perceive more value than the price asks, compared to the next best alternative? This is the core question. It requires knowing both your own perceived value (M9) and your competitors' — and understanding whether the price premium or discount relative to alternatives is perceived as justified.
Willingness to pay (332): Is the pricing strategy grounded in customer WTP research, not internal cost-plus assumptions? WTP is not what customers say they would pay in a survey. It is the revealed willingness — what they actually pay, what they pay for competitors, and where the price sensitivity curve breaks. WTP research requires customer interviews, competitive analysis, and price sensitivity testing. Without it, dimension 330 cannot score above +1.
Cost coverage (333): Does the price account for all costs associated with delivering the value proposition — including the hidden costs of service, support, onboarding, and relationship management that are routinely underestimated? A price that does not cover full costs is not a strategic choice. It is a delayed crisis.
Positioning alignment (334): Is the price consistent with brand positioning and category goals? This is the price/positioning test applied systematically. Premium positioning requires premium-range pricing. Value positioning requires price-accessible pricing. Misalignment here is not a pricing problem — it is a brand architecture problem that dimension 330 surfaces.
Prices in the Marketing Canvas
The canonical question
Does your pricing strategy reflect the value you deliver, align with customer willingness to pay, and support your positioning?
Prices appears in the Vital 8 of three archetypes in roles that reflect its strategic weight:
Primary Accelerator for A6 (Value Harvester): The Value Harvester is extracting maximum cash flow from an existing customer base. Pricing power — the ability to raise prices, introduce premium tiers, and increase ARPU without triggering churn — is the primary growth mechanism. For A6, dimension 330 is not defensive. It is the offensive lever. Every pricing improvement directly converts to margin.
Secondary Brake for A2 (Efficiency Machine): An Efficiency Machine competes on cost leadership. The pricing risk is margin erosion — the downward pressure of competitive price-matching that can turn cost leadership into a race to zero. Dimension 330 scores whether the pricing strategy protects the margin structure that makes efficiency sustainable. For A2, price must be low enough to win volume without being so low that the cost model collapses.
Secondary Brake for A8 (Niche Expert): For the Niche Expert, the ability to raise prices is the proof that expertise is real. A niche authority that charges the same as a generalist is signalling that the niche does not command a premium — which undermines the authority itself. Hermès raises prices 5–8% annually and the market absorbs it. That is not arrogance. That is a dimension 330 score of +3 demonstrating that the niche position is genuine.
Growth Driver for A2 and A8: In both, pricing optimisation — raising prices toward the WTP ceiling, introducing tiered offerings, or expanding into premium segments — is a direct revenue lever that does not require new customer acquisition.
Statements for self-assessment
Rate your agreement on a scale from −3 (completely disagree) to +3 (completely agree). There is no zero — the Marketing Canvas forces a directional position on every dimension.
Note on Detailed Track scoring: if averaging sub-question scores produces a mathematical zero, the method rounds to −1. A split score means the dimension is not clearly helping your goal — and "not clearly helping" requires the same investigation as "hurting."
Interpreting your scores
Negative scores (−1 to −3): Pricing is misaligned with customer WTP, disconnected from positioning, or set by cost and competitive reference alone. The likely result: either margin erosion (underpricing) or purchase friction and resentment (overpricing). Pricing is not functioning as a strategic asset.
Positive scores (+1 to +3): Pricing is grounded in WTP research, consistent with positioning, covers full costs, and actively reinforces the value proposition rather than contradicting it. Customers perceive the price as justified. The price/positioning test passes without qualification.
Case study: Green Clean
Green Clean is a fictional eco-friendly residential cleaning service used as the recurring worked example throughout the Marketing Canvas Method.
Score: −2 to −1 (Weak) Green Clean's price of $200 per visit was set by looking at EcoPure ($260) and splitting the difference with NatureFresh ($140). No WTP research was conducted. No customer was asked what they would pay for a service that could verifiably protect indoor health rather than just clean with eco products. The price covers costs — just. But it does not reflect the value premium Green Clean is attempting to claim. The health-first positioning demands a price signal that says "this is a specialist service, not a cleaning commodity." At $200 in a market where the eco-follower charges $140, the $60 premium is too modest to reinforce the category distinction and too large to be dismissed as rounding error. The price is caught between value and premium without committing to either. Pricing is set by cost and competitive reference, not by customer WTP or positioning logic.
Score: +1 to +2 (Developing) Green Clean has conducted basic WTP research — six customer interviews and a price sensitivity survey of 40 existing customers. The data suggests that health-conscious parents with children under 10 have a WTP ceiling of approximately $230 for a verified health-protection service, compared to $170 for a standard eco-cleaning service. This validates a $200 entry price as accessible to the primary segment. But the full pricing architecture is incomplete: there is no premium tier for customers who want quarterly indoor air quality testing, no subscription discount structure that rewards commitment, and no articulated reason in the sales conversation for why $200 reflects value rather than cost. The price is in the right zone. The strategy around it is not yet complete.
Score: +2 to +3 (Strong) Green Clean's pricing architecture is fully aligned with positioning and WTP evidence. The standard service at $200 is priced as the accessible entry to health-first home care — above the eco-follower (NatureFresh at $140) to reinforce the quality signal, below the premium leader (EcoPure at $260) to remain accessible to the early believer segment. A premium tier at $240 includes quarterly indoor air quality baseline testing — a feature that translates health-first positioning into a tangible deliverable and captures WTP from the highest-intent segment. An annual subscription at $185/visit rewards commitment while improving LTV. The sales conversation anchors the $200 price to the university-validated formula and third-party certifications — making the price a consequence of quality, not a financial decision. Customers who ask "why not NatureFresh for $140?" receive a specific answer about what the $60 buys. Churn is lower in the premium tier than in the standard tier — confirming that the pricing architecture is reinforcing, not diluting, loyalty.
Connected dimensions
Prices does not operate in isolation. Four dimensions connect most directly:
310 — Features: Features justify the price. A unique functional benefit — the only independently validated non-toxic formula in the region — is the justification for a price premium. Without a unique feature, premium pricing is a claim without a foundation.
220 — Positioning: Price must match position. The price/positioning test is the most direct connection between these two dimensions. Positioning defines the promise. Prices either confirms or contradicts it at the first moment of commercial truth.
340 — Proof: Proofs reduce price sensitivity. A customer who has seen the university validation data, the B-Corp certification, and the Family Health Report is less price-sensitive than one who hasn't. Proof shifts the perceived value upward, which expands the WTP range and makes the price feel justified rather than expensive.
620 — ARPU: Pricing directly drives revenue per user. Every pricing decision — entry price, premium tier, subscription structure, annual increase — translates directly into ARPU. Dimension 330 and dimension 620 should be reviewed together: the pricing architecture is the primary lever for ARPU improvement without requiring new customer acquisition.
Conclusion
Prices is the dimension that either validates or undermines everything else in the value proposition. A product can have a unique feature, a designed emotional benefit, and a compelling purpose — and a price that signals none of it is real.
The strategic discipline is not to price low enough to be accessible or high enough to be premium. It is to price at the level where the customer perceives the value as justified relative to alternatives — and to ensure that perception is managed actively, not left to whatever the market average happens to be.
The price/positioning test is the fastest audit available: premium position + discount price = cognitive dissonance. Value position + premium price = resentment. When the price matches the promise, dimension 330 is working. When it doesn't, everything upstream is harder.
Sources
Thomas Nagle, Georg Müller, The Strategy and Tactics of Pricing, Routledge, 6th edition, 2018
Hermann Simon, Confessions of the Pricing Man, Springer, 2015
Marketing Canvas Method, Appendix E — Dimension 330: Prices, Laurent Bouty, 2026
About this dimension
Dimension 330 — Prices is part of the Value Proposition meta-category (300) in the Marketing Canvas Method. The Value Proposition meta-category contains four dimensions: Features (310), Emotions (320), Prices (330), and Proof (340).
The Marketing Canvas Method is a complete marketing strategy framework built around 6 meta-categories, 24 dimensions, and 9 strategic archetypes. Learn more at marketingcanvas.net or in the book Marketing Strategy, Programmed by Laurent Bouty.
Marketing Canvas - Emotions
Features bring customers in. Emotions keep them and make them advocate. Dimension 320 of the Marketing Canvas distinguishes between the emotional job customers want to feel in their lives and the emotional benefit your product actually delivers — and explains why B2B brands skip this distinction at their peril.
About the Marketing Canvas Method
This article covers dimension 320 — Emotions, part of the
Value Proposition meta-category. The Marketing Canvas Method structures
marketing strategy across 24 dimensions and 9 strategic archetypes.
Full framework reference at
marketingcanvas.net →
·
Get the book →
In a nutshell
Emotions (dimension 320) scores the emotional benefits your product delivers — how it makes customers feel during use. Not what customers want to feel in their lives. What your product actually makes them feel when they interact with it.
That distinction matters more than it first appears. It is the line that separates dimension 320 from the emotional layer of JTBD (110). And it is the reason a high Emotions score requires intentional design, not just a good product.
In the Marketing Canvas, Emotions sits within the Value Proposition meta-category alongside Features (310), Prices (330), and Proof (340). It is the amplification layer: Features answers what does it do?, Emotions answers how does it feel?
The critical distinction: emotional job vs. emotional benefit
This is the most important conceptual clarification in dimension 320 — and the one most commonly missed.
JTBD emotional job (dimension 110): what the customer wants to feel in their life as a result of getting the job done. This is the desire.
Emotional benefit (dimension 320): what the product actually makes the customer feel during use. This is the delivery.
Spotify's JTBD emotional job: "feel connected to music that matches my mood." That is what the customer wants from music in their life. Spotify's emotional benefit: "feel delighted by the Discover Weekly playlist that somehow knows what I'll love." That is what the product delivers at the moment of interaction — the specific feeling engineered into the user experience.
The job is the target. The benefit is the arrow.
A brand that only understands the job — "our customers want to feel safe at home" — is working with a target. A brand that has designed the specific moment, interaction, or communication that produces that feeling — the Family Health Report showing exactly what toxins were eliminated during this visit — has built the arrow.
Score negative if emotional benefits are absent or assumed. Score positive when the emotional experience is designed, measured, and consistently delivered — not left to chance.
Emotions in B2B: the most commonly skipped dimension
Most B2B companies skip dimension 320 entirely, on the assumption that professional purchasing decisions are rational. They are not.
Every B2B buyer is a human. They feel relief when a vendor delivers ahead of schedule. They feel frustration when an SLA is missed and the account manager goes quiet. They feel pride when their technology choice is validated at a board meeting. They feel anxiety when a renewal conversation begins without a clear value case. Every one of those feelings is a scored emotional benefit — or a missed one.
The B2B Elements of Value framework (Harvard Business Review, 2018) identified 40 distinct value elements that B2B buyers care about, of which a significant proportion are emotional: confidence, reduced anxiety, design and aesthetics, reputation enhancement. None of them appear in a feature specification. All of them influence the purchase decision.
The operational implication: B2B brands that score 320 honestly often discover it is their weakest Value Proposition dimension. Not because they have bad products. Because nobody has ever asked "what does the customer feel when they open our invoice?" or "how does the onboarding experience make a new user feel in the first ten minutes?" Those feelings exist. They are just unmanaged.
The three levels of emotional benefits
Emotional benefits operate on the same three-tier structure as Features:
Core emotional benefits (321) — feelings the category requires. A luxury hotel must feel indulgent. A bank must feel trustworthy. A healthcare provider must feel reassuring. These are not differentiators — they are the price of emotional admission. Failing to deliver them triggers category-level disqualification, not just competitive disadvantage.
Differentiating emotional benefits (322) — feelings competitors don't consistently deliver. A budget airline that feels funrather than merely tolerable. A B2B software platform that makes users feel smart rather than simply competent. A cleaning service that makes customers feel like they are doing something meaningful rather than just maintaining hygiene. Differentiating emotional benefits create loyalty in mature markets where functional features have converged.
Unique emotional benefit (323) — the single emotional experience that becomes the primary reason customers choose you and talk about you. One. The discipline of naming exactly one forces the same strategic prioritisation as the unique feature in dimension 310. For Green Clean: the moment when a parent reads their Family Health Report and feels, for the first time, certifiably confident that their home is safe — not just probably cleaner. That specific feeling — evidenced, not inferred — is the unique emotional benefit.
Emotions in the Marketing Canvas
The canonical question
How does your product make customers feel?
Emotions is a Primary Accelerator for three archetypes — and in all three, the rationale is the same: the emotional dimension is what transforms a functional product into something customers feel compelled to talk about.
Primary Accelerator for A1 (Disruptive Newcomer): Disruption without emotion is a better mousetrap. A technically superior product that nobody talks about will be outpaced by a technically adequate product that generates word-of-mouth. Disruption spreads through emotional resonance — the feeling of "I can't believe I didn't have this before" — not through feature comparisons. For A1, Emotions is the dimension that converts awareness into advocacy.
Primary Accelerator for A3 (Brand Evangelist): The tribe forms around shared feeling, not shared specification. Patagonia customers don't discuss thread counts at Sturgis equivalents — they share the feeling of moral coherence that comes from wearing a brand whose values match theirs. For A3, the unique emotional benefit is the membership fee: access to the feeling that makes you part of something. Without it, there is no tribe, only customers.
Primary Accelerator for A9 (Category Creator): Category creation without emotion is a white paper. A new category must make people feel something before they can understand it rationally. Green Clean's category — "health-first home care" — gained traction when customers began feeling something specific: the combination of peace of mind and activist pride that came from being early. The feeling arrived before the category language did. For A9, emotional benefit design is the market education tool.
Designing emotional benefits: from accidental to intentional
The most common Emotions failure is not negative emotion — it is accidental emotion. The product generates feelings, but they are inconsistent, unmeasured, and not connected to the strategy.
Three questions that convert emotional outcomes from accidental to designed:
1. What feeling do we want to produce at this specific moment? Not "what feeling do we want customers to have in general" — but at the moment they open the package, read the first report, complete onboarding, speak to support, or receive the invoice. Each moment has a designed emotional target.
2. What are we actually producing right now? This requires measurement — customer verbatims, NPS qualitative data, interview findings. Not assumption. "We think customers feel confident" is worth zero in a Vital Audit. "Customers use the words 'relieved' and 'reassured' in 73% of post-service comments" is a +2.
3. What is the gap? The difference between the designed target and the measured outcome is the initiative. If the target is "feel like an expert" and customers report feeling "slightly confused," the initiative is redesigning onboarding — not relaunching the product.
Statements for self-assessment
Rate your agreement on a scale from −3 (completely disagree) to +3 (completely agree). There is no zero — the Marketing Canvas forces a directional position on every dimension.
Note on Detailed Track scoring: if averaging sub-question scores produces a mathematical zero, the method rounds to −1. A split score means the dimension is not clearly helping your goal — and "not clearly helping" requires the same investigation as "hurting."
Interpreting your scores
Negative scores (−1 to −3): Emotional benefits are absent, assumed, or accidental. Customers feel something, but not what the brand intends, and not consistently. The product competes on functional terms alone — a position that degrades as competitors converge on feature parity. For archetypes where Emotions is a Primary Accelerator, a negative score here explains why advocacy, tribal loyalty, or category traction is not materialising.
Positive scores (+1 to +3): Emotional benefits are designed, measured, and consistently delivered. The brand can name the specific feeling it targets at specific touchpoints, and customer research confirms it is being produced. The unique emotional benefit is owned — customers describe it unprompted, in consistent language, as a reason they chose and stayed.
Case study: Green Clean
Green Clean is a fictional eco-friendly residential cleaning service used as the recurring worked example throughout the Marketing Canvas Method.
Score: −2 to −1 (Weak) Green Clean's emotional outcomes are entirely accidental. Some customers feel good about using eco-friendly products. Some feel vaguely virtuous. Nobody on the team can name what specific feeling Green Clean is trying to produce at any specific touchpoint. The onboarding has no designed emotional arc. The invoices are transactional. The post-service communication is a generic "thank you." When customers describe the experience in feedback, they use words like "fine" and "professional" — category-level emotional responses, not brand-specific ones. No unique emotional benefit has been identified, let alone designed. The emotional job customers have — "feel certifiably safe at home, not just probably cleaner" — is understood at the JTBD level. But no interaction has been designed to deliver that feeling specifically.
Score: +1 to +2 (Developing) Green Clean has identified the unique emotional target: the feeling a health-conscious parent gets when they receive evidence — not marketing claims — that their home is genuinely safer. The Family Health Report was built to produce this feeling: it shows exactly which toxins were eliminated during this visit, quantified, in language a non-scientist can understand. In customer interviews, parents describe receiving the report with words like "finally" and "I can actually prove it now." The designed feeling is landing. But it is only landing for customers who receive the full-service experience. The pre-service and acquisition journey still produces generic "eco-friendly" feelings that match every competitor. Consistency across the full journey is still developing.
Score: +2 to +3 (Strong) Green Clean's emotional benefit architecture is designed, measured, and consistent across all touchpoints. Core: trust (every claim is verified by third-party data — no customer feels deceived). Differentiating: activist pride (the annual impact statement gives customers something to share — "my household prevented X kg of chemical exposure in 2024"). Unique: certified confidence (the Family Health Report produces a specific, named feeling that customers describe consistently: "I know, not just hope." In 2024 customer surveys, 68% of respondents use language about certainty or proof when describing what makes Green Clean different — a directly measurable emotional signature. The unique emotional benefit is owned, produced consistently, and confirmed by measurement.
Connected dimensions
Emotions does not operate in isolation. Four dimensions connect most directly:
110 — JTBD: The emotional job defines the target feeling. The JTBD emotional layer tells you what feeling customers want to achieve in their lives. Dimension 320 scores whether your product delivers that feeling in practice. JTBD is the brief. Emotions is the execution.
120 — Aspirations: Emotional benefits serve identity aspirations. The feeling a customer gets from using the product should connect to who they are trying to become. A customer who aspires to be a "responsible protector of their family" and feels certifiably confident after the Family Health Report has had both their aspiration and their emotional benefit served simultaneously.
310 — Features: Features enable, emotions amplify. The proprietary formula is a Feature. The feeling of knowing your home is scientifically validated as safer is the Emotion. Features create the conditions for emotional delivery. Without the formula, the confidence feeling has no credible foundation. Without the designed emotional delivery, the formula remains a technical specification.
440 — Magic: Magic creates peak emotional moments. Where Emotions (320) designs the consistent emotional baseline, Magic (440) scores the unexpected moments that exceed expectations and generate organic advocacy. The two dimensions work in sequence: Emotions sets the floor, Magic creates the peaks.
Conclusion
Dimension 320 is the dimension that separates brands customers use from brands customers talk about. Features bring customers in. Emotions keep them and make them advocate.
The scoring discipline is not "do our customers feel good?" Most brands with reasonable products generate positive feelings sometimes. The question is whether those feelings are designed, measured, and consistent — produced at predictable moments for intentional reasons — or whether they are the accidental byproduct of a functional interaction.
Disruption without emotion is a better mousetrap. Category creation without emotion is a white paper. Brand evangelism without emotion is a loyalty programme. In every archetype where Emotions appears as a Primary Accelerator, the same principle holds: the emotional dimension is what converts a good product into something people feel compelled to tell others about.
Sources
Harvard Business Review, "The New Science of Customer Emotions", November 2015 — hbr.org
Harvard Business Review, "The B2B Elements of Value", March 2018 — hbr.org
Marketing Canvas Method, Appendix E — Dimension 320: Emotions, Laurent Bouty, 2026
About this dimension
Dimension 320 — Emotions is part of the Value Proposition meta-category (300) in the Marketing Canvas Method. The Value Proposition meta-category contains four dimensions: Features (310), Emotions (320), Prices (330), and Proof (340).
The Marketing Canvas Method is a complete marketing strategy framework built around 6 meta-categories, 24 dimensions, and 9 strategic archetypes. Learn more at marketingcanvas.net or in the book Marketing Strategy, Programmed by Laurent Bouty.
Marketing Canvas - Features
Having twenty features means nothing if none of them is the definitive reason to buy. Dimension 310 of the Marketing Canvas scores features on three levels — core, differentiating, unique — and explains why it appears in seven of the nine strategic archetypes.
About the Marketing Canvas Method
This article covers dimension 310 — Features, part of the
Value Proposition meta-category. The Marketing Canvas Method structures
marketing strategy across 24 dimensions and 9 strategic archetypes.
Full framework reference at
marketingcanvas.net →
·
Get the book →
In a nutshell
Features (dimension 310) scores the functional benefits your product delivers — the tangible, measurable things it does. Not your feature list. The strategic question behind the list: does any feature on it give a customer a definitive reason to choose you over every alternative?
Most companies confuse feature presence with feature strategy. Having twenty features means nothing if none of them is the definitive reason to buy. The Marketing Canvas scores Features on three levels — core, differentiating, and unique — precisely to force that distinction.
In the Marketing Canvas, Features sits within the Value Proposition meta-category alongside Emotions (320), Prices (330), and Proof (340). It is the functional foundation of why customers should choose you — the layer that precedes and justifies everything else in the value proposition.
Feature presence vs. feature strategy
The most common Features failure is not having too few features. It is having too many — and none that matters decisively.
LEGO discovered this at near-fatal cost. By 2003, the company was losing $1 million per day. An audit revealed that 94% of product sets were unprofitable. The feature portfolio — 12,500 unique brick elements — had expanded far beyond what the job required. Designers were adding complexity because they could, not because customers needed it. The fix was surgical: cut from 12,500 to 6,500 elements, exit every product line that didn't serve the core job, return to the brick. Revenue tripled within seven years.
The discipline the LEGO case illustrates is canonical: features must align with JTBD, not with engineering ambition. Every feature that doesn't serve the customer's job is complexity without value — it adds cost, confuses communication, and dilutes the one feature that actually makes the difference.
The scoring test is direct: can your team name the single functional benefit that would make a customer choose you over every alternative — and do customers confirm it? If yes, the dimension can score +2 or above. If the team names five features when asked for one, or if customers choose a different reason than the team names, the score stays at +1 or below.
The three levels of features
The Marketing Canvas structures Features across three scored levels:
Core functional benefits (311) — the table-stakes features the category requires. Every competitor has them. Not having them means automatic disqualification. For a cleaning service: cleaning efficacy. For a bank: reliable transaction processing. For a SaaS platform: uptime and security. Core features are not differentiators — they are the price of admission. Failing here means the product is not competitive, not merely uninteresting.
Differentiating functional benefits (312) — features that set you apart from direct competitors. Not unique — other players could have them — but not universally present. For Green Clean: non-toxic formula safe for children and pets. For a bank: 24-hour human support. For a SaaS platform: native integration with the three tools their specific customer segment uses daily. Differentiating features create preference within a consideration set. They are not enough to win alone — they narrow the choice.
Unique functional benefit (313) — the single feature that becomes the primary reason customers choose you. One feature. The discipline of naming exactly one forces strategic prioritisation that most teams resist. For Green Clean: the proprietary formula developed with a university partner — the only independently validated non-toxic cleaning formula in the region. That is the unique feature. Not the packaging. Not the health report. The formula is why a competitor cannot replicate the claim. The other features support it. Only one owns the reason to buy.
Score negative if the product lacks category table-stakes or if no functional benefit is unique. Score positive when you can name the one feature that would make a customer choose you, and customers confirm it without prompting.
Features in the Marketing Canvas
The canonical question
What does your product actually do that solves the customer's problem?
Strategic role: the most tested dimension in the method
Features appears in the Vital 8 of seven of the nine archetypes — more than any other dimension. When in doubt about where to start a strategic audit, start here.
The roles vary by archetype context:
Fatal Brake for A1 (Disruptive Newcomer): A disruptor's entire existence depends on being demonstrably better. If the product lacks a unique functional benefit, disruption is just a pitch. Features must score ≥+2 before any other A1 investment makes sense.
Fatal Brake for A8 (Niche Expert): Expert authority must be grounded in product depth the generalist cannot match. A niche expert with average features is simply a generalist with a narrow audience. The unique feature is what makes the expertise real and defensible.
Fatal Brake for A9 (Category Creator): You cannot create a category around a feature you haven't built. Green Clean's category — "health-first home care" — required the proprietary formula as tangible proof the category was real. Without it, the job definition is a marketing claim, not a business. For A9, features are the physical evidence that the new category exists.
Primary Accelerator for A2 (Efficiency Machine): Operational features — automation, self-service, friction elimination — are the mechanism through which an Efficiency Machine delivers its value. For A2, features are not about superiority. They are about operational execution. Magic (440) is the adjacent dimension, but Features sets the floor.
Primary Accelerator for A5 (Pivot Pioneer): A pivot requires building new features that prove the new direction is real. LEGO's licensing partnerships (Star Wars sets, Harry Potter) and the LEGO Ideas platform were Features decisions that proved the pivot wasn't just a rebrand. For A5, new features are the evidence of transformation.
Secondary Brake for A6 (Value Harvester): A company harvesting maximum cash flow from an existing base must maintain the core and differentiating features that keep customers from churning. Feature decay — letting table-stakes slip — is the fastest way to accelerate churn in an A6 situation.
Growth Driver for A4, A5, A8: In all three, feature expansion into adjacent jobs or deeper niche capabilities is the primary growth lever.
Purpose alignment: the strategic filter
Features also connect directly to Purpose (210). If Green Clean's purpose is "eliminate indoor toxins and make healthy homes the standard," every functional benefit must serve that purpose.
A feature that makes cleaning faster — without improving toxin elimination — is not strategically aligned, even if it is competitively useful. It dilutes the purpose, confuses the positioning, and makes the unique benefit harder to communicate. The purpose is the filter that decides which features belong in the portfolio and which belong elsewhere.
This is the practical test: for each feature in your product, ask "does this serve our purpose?" If the answer is no, the feature is either strategically misaligned or the purpose statement is wrong. One of them needs to change.
Statements for self-assessment
Rate your agreement on a scale from −3 (completely disagree) to +3 (completely agree). There is no zero — the Marketing Canvas forces a directional position on every dimension.
Note on Detailed Track scoring: if averaging sub-question scores produces a mathematical zero, the method rounds to −1. A split score means the dimension is not clearly helping your goal — and "not clearly helping" requires the same investigation as "hurting."
Interpreting your scores
Negative scores (−1 to −3): The product lacks category table-stakes, lacks differentiation, or lacks a unique feature that gives customers a decisive reason to choose. The likely outcome: customers who compare you with alternatives find no compelling reason to prefer you. Competition defaults to price.
Positive scores (+1 to +3): The product meets category expectations, offers differentiated benefits, and has a unique functional benefit that customers name unprompted as the reason they chose you. Features are aligned with JTBD, purpose, and positioning. The feature portfolio is strategic — not just comprehensive.
Case study: Green Clean
Green Clean is a fictional eco-friendly residential cleaning service used as the recurring worked example throughout the Marketing Canvas Method.
Score: −2 to −1 (Weak) Green Clean uses standard commercial cleaning products with a plant-based marketing claim. The cleaning efficacy is below the category leader (EcoPure). There is no feature that differentiates Green Clean from NatureFresh. The "eco-friendly" claim is generic and shared by every competitor in the market. When asked what makes Green Clean different, the founder lists four things — a sign that no single feature has been identified as the decisive reason to choose. The team cannot name the one feature that makes Green Clean the choice. Customers who investigate find nothing that competitors don't also offer. Core features are present. Differentiating features are weak. Unique feature: absent.
Score: +1 to +2 (Developing) Green Clean has developed a proprietary non-toxic cleaning formula in partnership with a university chemistry department. The formula has been independently tested and validated — no competitor in the region has equivalent third-party verification. This is the unique feature. But it is not yet consistently communicated: some marketing materials lead with packaging, others with eco-certification, others with the formula. The unique feature exists but is not yet positioned as the single reason to choose Green Clean. The B-Corp certification is a strong differentiating feature — rare in the market and credible. Core features (cleaning efficacy, reliability, convenience) meet category expectations. The unique feature is built. The strategy around it is not yet fully deployed.
Score: +2 to +3 (Strong) Green Clean's feature portfolio is strategically structured and purposefully communicated. Core: cleaning efficacy verified against market benchmark, reliable scheduling, flexible booking. Differentiating: B-Corp certification (first in region), zero-waste operations, Family Health Report transparency dashboard. Unique: proprietary university-developed formula — the only independently validated non-toxic cleaning formula in the region. Every piece of marketing leads with the formula. Every sales conversation anchors to it. Every competitor analysis uses it as the point of comparison. Customers asked why they chose Green Clean give the same answer: "the formula is the only one that's actually been tested by scientists, not just labelled eco-friendly." The unique feature is owned, communicated, and confirmed by customers.
Connected dimensions
Features does not operate in isolation. Four dimensions connect most directly:
110 — JTBD: Features must solve the job. Every feature in the portfolio should trace back to a specific customer job. If a feature cannot be linked to a job, it is either complexity without value or a signal that the job is not yet well-defined.
220 — Positioning: Positioning promises what features deliver. A positioning statement of "the indoor health protection company" requires features that deliver health protection — specifically and verifiably. Features that don't support the positioning create a credibility gap the customer will eventually feel.
330 — Prices: Features justify the price. Premium pricing requires a unique feature — or a combination of differentiating features — that customers recognise as worth the premium. Without them, premium positioning is a claim, not a value proposition.
340 — Proof: Proofs demonstrate features work. The unique feature is only as strong as the evidence behind it. Green Clean's proprietary formula scores +3 on Features because it is backed by independent university validation — that is a Proof (340) asset, not just a feature claim.
Conclusion
Features is the most tested dimension in the Marketing Canvas for a reason: it is the operational core of the value proposition. Every archetype that depends on product superiority, operational execution, or category creation roots that strategy in a specific feature configuration.
The strategic discipline is not to build more features. It is to identify the one feature that is the definitive reason to buy — and then build everything else to support and prove it. LEGO's recovery did not begin with new product innovation. It began with the recognition that the existing product was the right answer, applied incorrectly. Cutting 6,000 brick elements was a Features strategy. It produced a 155% revenue increase in seven years.
The question is not "what do we offer?" It is "what is the one thing that makes a customer choose us?" If the answer takes more than one sentence, the feature strategy is not yet complete.
Sources
Alexander Osterwalder, Yves Pigneur, Business Model Generation, Wiley, 2010 — strategyzer.com
David Robertson, Bill Breen, Brick by Brick: How LEGO Rewrote the Rules of Innovation and Conquered the Global Toy Industry, Crown Business, 2013
Marketing Canvas Method, Appendix E — Dimension 310: Features, Laurent Bouty, 2026
About this dimension
Dimension 310 — Features is part of the Value Proposition meta-category (300) in the Marketing Canvas Method. The Value Proposition meta-category contains four dimensions: Features (310), Emotions (320), Prices (330), and Proof (340).
The Marketing Canvas Method is a complete marketing strategy framework built around 6 meta-categories, 24 dimensions, and 9 strategic archetypes. Learn more at marketingcanvas.net or in the book Marketing Strategy, Programmed by Laurent Bouty.
Marketing Canvas - Visual Identity
Visual identity is the only Brand dimension customers score before any interaction begins. The first impression formed from a colour, a typeface, or a photography style is a scoring event — rapid and largely subconscious. Dimension 240 of the Marketing Canvas applies four tests to determine whether what customers see matches what the brand stands for.
About the Marketing Canvas Method
This article covers dimension 240 — Visual Identity, part of the
Brand meta-category. The Marketing Canvas Method structures
marketing strategy across 24 dimensions and 9 strategic archetypes.
Full framework reference at
marketingcanvas.net →
·
Get the book →
In a nutshell
Visual Identity (dimension 240) is the visible expression of everything the brand stands for — logo, typography, colour, photography style, tone of voice, packaging, store design, digital experience. It is the layer customers actually see and touch.
Purpose, Positioning, and Values are internal architecture. Visual Identity is the façade that makes that architecture legible to the outside world. A brand can have a sharp purpose and clear values that customers never perceive, because the visual signals contradict or dilute them. Dimension 240 scores whether the visible layer matches the promise.
In the Marketing Canvas, Visual Identity sits within the Brand meta-category alongside Purpose (210), Positioning (220), and Values (230). It is the last of the four Brand dimensions — the one that translates all the others into something a customer can actually recognise.
What visual identity actually is
Visual identity is not just a logo. It is the complete system of signals that make a brand recognisable before a single word is read.
The most common failure in visual identity is not ugliness. It is inconsistency. A premium positioning with a budget-looking website creates cognitive dissonance. An innovation purpose with a conservative visual identity sends mixed signals. A sustainability-led brand using stock photography of white offices and generic smiling faces undermines its own story.
The Marketing Canvas tests Visual Identity against four questions — the same four that determine whether an identity is an asset or a liability:
Consistency — Does the brand feel the same across every touchpoint? Website, social media, packaging, sales presentations, email signatures, physical locations: the brand feeling should survive the channel change.
Alignment — Does the identity reflect Purpose, Positioning, and Values? A brand that stands for transparency should look transparent — open, legible, uncluttered. A brand that stands for premium craft should look handmade, not mass-produced.
Distinctiveness — Is the brand recognisable without the logo? This is the hardest test. Strip the logo from a social post, a packaging shot, a trade show stand. If the brand could belong to any competitor, distinctiveness is failing.
Likeability — Do target audiences find it appealing? Not universally appealing — strategically appealing to the specific people the brand is trying to reach.
Score negative when the brand looks different on social media than in stores, or when competitors' visual identities are interchangeable with yours. Score positive when someone encountering the brand in a new context — a trade show, a LinkedIn post, a delivery box — would recognise it instantly.
Visual identity in the Marketing Canvas
The canonical question
Is your brand instantly recognisable, and does what customers see reflect what you stand for?
Visual Identity appears in the Vital 8 of three archetypes — in different roles, for different strategic reasons:
Secondary Brake for A1 (Disruptive Newcomer): A disruptor entering a new market depends on being noticed and understood immediately. Rapid growth frequently outpaces identity coherence — different teams produce different materials, brand guidelines are informal, the visual language fragments. For A1, a weak Visual Identity score means the story isn't landing even when the product is right.
Secondary Brake for A7 (Scale-Up Guardian): The Scale-Up Guardian faces the same problem at higher speed. Hypergrowth across geographies, channels, and team sizes is the fastest way to dilute visual identity. The brand that looked coherent at 50 employees starts to splinter at 500. Protecting visual identity during scale is the A7 challenge — it requires governance, not just creativity.
Secondary Accelerator for A9 (Category Creator): A company creating a new market category faces a specific visual identity problem: customers cannot yet visualise what the category looks like. A distinctive, ownable visual identity helps customers recognise the new category before they fully understand it. Green Clean's visual shift — moving from generic eco-green to clinical-white-with-green-accents — signalled "health protection" rather than "cleaning products." The visual identity taught the category.
The four tools of visual identity
Visual identity is built from five core components. Each needs to be managed as part of a system, not designed in isolation:
Logo — The anchor of the system. Should be instantly recognisable, scalable from a favicon to a billboard, and capable of standing alone without a tagline. The logo is not the brand, but it is the most compressed expression of it.
Colour palette — The most powerful recognition tool. Colour increases brand recognition by up to 80% and is the first element processed in snap judgements. A primary colour and a disciplined secondary palette give the system range without incoherence. Proprietary colour ownership — the kind Tiffany has with its blue, or Hermès with its orange — is a competitive asset that takes years to build and seconds to dilute.
Typography — Fonts carry personality at a subconscious level. A modern sans-serif suggests clarity and accessibility. A refined serif suggests heritage and authority. Mixing type families without a clear logic produces visual noise. Most brands need two typefaces: one for display (personality), one for body (readability).
Imagery — Photography style, illustration conventions, graphic elements, and iconography. This is where most brands lose consistency first. When three different teams commission three different photographers with three different briefs, the imagery stops telling a single story.
Brand guidelines — The document that makes the system sustainable. Not a creative constraint — a consistency engine. Without guidelines, every new hire, agency, and market makes independent decisions that slowly fragment the identity.
Why consistency is a strategic imperative
Research consistently shows that visual consistency is not just an aesthetic preference — it is a commercial one.
Studies find that consistent branding across platforms can increase revenue by 33%, and that 73% of consumers trust a brand more when it presents a consistent visual identity. The Ehrenberg-Bass Institute found that products from high-cohesion brand portfolios achieve 17% higher brand recall than those from low-cohesion portfolios — a measurable commercial effect from visual discipline alone.
The mechanism is psychological: visual consistency is interpreted as reliability. A brand that looks the same everywhere signals that it behaves the same everywhere. Inconsistency, even subtle, reads as unprofessionalism or worse — as a brand that does not fully believe its own story.
Statements for self-assessment
Rate your agreement on a scale from −3 (completely disagree) to +3 (completely agree). There is no zero: the Marketing Canvas forces a directional position on every dimension.
Note on Detailed Track scoring: if averaging sub-question scores produces a mathematical zero, the method rounds to −1. A split score means the dimension is not clearly helping your goal — and "not clearly helping" requires the same investigation as "hurting."
Interpreting your scores
Negative scores (−1 to −3): Your visual identity lacks consistency, alignment, or distinctiveness — or all three. The likely result: customers cannot recognise the brand across contexts; the visual signals contradict the positioning; trust erodes because the brand looks different in different places. The identity is not working as a strategic asset.
Positive scores (+1 to +3): Your visual identity is consistent, aligned with purpose and values, distinctively ownable, and liked by the right audiences. The brand is recognisable without the logo. The visual layer makes the strategic promise visible and believable before a word is read.
Case study: Green Clean
Green Clean is a fictional eco-friendly residential cleaning service used as the recurring worked example throughout the Marketing Canvas Method.
Score: −2 to −1 (Weak) Green Clean's visual identity was assembled rather than designed. The website uses a stock photography library of forests and leaves. The social media uses bright greens and cartoonish icons. The service vehicle is plain white. The invoice template is a generic Word document. There is no logo consistency rule: the stacked version appears on the website, the horizontal version on vehicles, and a wordmark variant on the app. A customer encountering Green Clean on Instagram would not recognise them on a doorstep. The four tests all fail. Consistency: no. Alignment: no (the visuals say "eco" not "health"). Distinctiveness: no. Likeability: inconclusive because there is no unified identity to evaluate.
Score: +1 to +2 (Developing) Green Clean has developed a visual identity system connecting "health" and "home" — a palette of off-white, clean greens, and clinical blues that signals medical-grade standards rather than generic eco-friendliness. The logo exists in one canonical version. Photography guidelines specify real homes, real light, real people — not stock. But execution is uneven: the vehicles haven't been updated, the invoice template still looks generic, and two social media accounts use different colour proportions. The system exists. It is not yet fully applied.
Score: +2 to +3 (Strong) Green Clean's visual identity passes all four tests without effort. A customer who finds them on Instagram, receives their Family Health Report, sees their van outside a neighbour's house, and reads a local press feature would recognise the brand immediately across all four contexts — without seeing the logo in three of them. The off-white and clean-green palette is theirs. The photography style — natural light, visible ingredient labels, children in the background — is theirs. Every touchpoint looks like it was made by the same team with the same brief. The identity makes the positioning visible before a word is read.
Connected dimensions
Visual Identity does not operate in isolation. Four dimensions connect most directly:
220 — Positioning: Visual identity makes positioning visible. A brand positioned as "the indoor health protection company" needs a visual language that looks clinical and trustworthy — not naturalistic and decorative. If the identity contradicts the positioning, customers feel the dissonance even if they cannot name it.
230 — Values: Visual identity expresses values without words. A transparency value requires an open, uncluttered visual language. An environmental integrity value requires imagery that shows real commitment, not stock nature photography.
430 — Channels: Channels must carry visual identity consistently. A brand present across six channels that applies its identity differently in each one loses the cumulative recognition effect that makes visual identity commercially valuable.
520 — Stories: Stories are told through visual identity. The photography style, colour palette, and typographic voice are the container for every piece of content the brand produces. A weak visual system undermines strong storytelling — the message is right but the vessel dilutes it.
Conclusion
Visual Identity is the only Brand dimension that customers score for you before any interaction begins. The first impression formed from a logo on a van, a colour on a packaging shelf, or a typography choice on a social post is a scoring event — a rapid, largely subconscious assessment of whether this brand looks like one worth trusting.
The strategic imperative is not to look beautiful. It is to look consistent. A mediocre identity applied with total discipline across every touchpoint outperforms a brilliant identity applied inconsistently. Consistency is what turns recognition into trust, and trust is what turns visual identity from a design asset into a commercial one.
Sources
Cameron Chapman, "A Logo Is Not a Brand", Harvard Business Review, June 2011 — hbr.org
Marty Neumeier, The Brand Gap, New Riders, 2006 — amazon.com
Ward, Trinh, Beal, Dawes, Romaniuk, "Standing out while fitting in: Visual branding cohesion across a product portfolio", Journal of Marketing Management, Ehrenberg-Bass Institute, January 2025 — journals.sagepub.com
Marketing Canvas Method, Appendix E — Dimension 240: Visual Identity, Laurent Bouty, 2026
About this dimension
Dimension 240 — Visual Identity is part of the Brand meta-category (200) in the Marketing Canvas Method. The Brand meta-category contains four dimensions: Purpose (210), Positioning (220), Values (230), and Visual Identity (240).
The Marketing Canvas Method is a complete marketing strategy framework built around 6 meta-categories, 24 dimensions, and 9 strategic archetypes. Learn more at marketingcanvas.net or in the book Marketing Strategy, Programmed by Laurent Bouty.
Marketing Canvas - Values
Most brands have values on a wall. Very few have values that change decisions. Dimension 230 of the Marketing Canvas scores the difference — and the acid test is a single question: can you name a decision made in the last year because of a stated value, even when a different decision would have been more profitable?
About the Marketing Canvas Method
This article covers dimension 230 — Values, part of the
Brand meta-category. The Marketing Canvas Method structures
marketing strategy across 24 dimensions and 9 strategic archetypes.
Full framework reference at
marketingcanvas.net →
·
Get the book →
In a nutshell
Values (dimension 230) are the core beliefs a brand would defend even when doing so is commercially costly. Not the list of adjectives on the careers page. The principles that visibly shape decisions — what the brand builds, who it hires, which partnerships it declines, which customers it turns away.
In the Marketing Canvas, Values sits within the Brand meta-category alongside Purpose (210), Positioning (220), and Visual Identity (240). If Purpose answers why we exist, Values answers how we behave. Purpose is the architecture. Values are the load-bearing walls that make it structurally sound — or expose it as a facade.
What values actually are
Most companies have values. Almost none of them are used.
The tell is simple. Ask three people on the leadership team to name the company's values without looking at a slide. Then ask them to name one decision made in the last twelve months that was made because of a stated value — a decision where the value-driven choice was harder or less profitable than the alternative.
If they can answer the second question, values are functional. If they cannot, values are decoration.
This is the acid test the Marketing Canvas applies to dimension 230: can you point to a specific decision in the past year that was made because of a stated value, even when a different decision would have been more profitable? A score of +2 or above requires a yes. Everything below that is still in progress.
Values are not aspirational. They are descriptive of current behaviour. "We aspire to be more transparent" is a goal. "We publish our ingredient list in full, even when competitors don't" is a value.
Values in the Marketing Canvas
The canonical question
Are your brand's values reflected in your behaviour and what you actually do?
Values is a Fatal Brake for two archetypes — the two where the absence of genuine values collapses the entire strategic logic:
A2 — Efficiency Machine: In a commodity market, customers need a reason not to feel embarrassed about their choice. Aldi's core value — smart shopping as intelligence, not compromise — reframes discount as a badge of sophistication. Without that value anchoring the positioning, Aldi is just cheap. The value is what makes cost leadership sustainable rather than a race to the bottom. For A2, values anchor the operational discipline that makes efficiency structural, not tactical.
A3 — Brand Evangelist: The tribe forms around shared values, not around products. Patagonia's 2011 "Don't Buy This Jacket" campaign — a full-page New York Times ad urging customers not to purchase unless they genuinely needed the product — only worked because the values were real. Any other company running that ad would have been called hypocritical. Patagonia's revenue increased. When values are authentic, they compound. For A3, values are the belief system. Without them, evangelism has nothing to evangelize.
The Harley-Davidson case illustrates what happens when values fail to evolve. Freedom and rebellion as expressed through loud heavyweight motorcycles resonated deeply with baby boomers. But values that are generationally locked are Fatal Brakes in slow motion. When the tribe's next generation defines freedom differently, the brand's values become a museum exhibit, not a compass. The failure wasn't operational. It was a Values (230) failure that the company tried to solve with a Features (310) answer — the LiveWire electric motorcycle. Wrong dimension, wrong diagnosis.
Values as differentiation
In markets where features converge, values become the last meaningful point of difference.
When two cleaning products perform identically, when two accounting software platforms offer similar functionality, when two airlines fly the same routes at comparable prices — the brand whose values align with the customer's identity wins. Not because the customer is irrational, but because identity is a real decision factor. People don't just buy what works. They buy what they want to be seen buying.
Kantar research confirms that in an increasingly volatile world, people want brands that can deliver on their promises and live up to their stated values. The implication is direct: values that are visibly lived are a competitive asset. Values that are stated but not demonstrated are a liability, inviting the cynicism that collapses trust faster than any product failure.
Research from Kantar's BrandZ study shows a clear link between brand strength and pricing power, with strong brands consistently commanding significantly higher prices than weaker ones. Values are a core input to that brand strength — they give customers a reason to choose that survives price comparisons.
Values vs. purpose vs. positioning
These three Brand dimensions are related but distinct. Conflating them produces vague strategy.
| Dimension | Question | Example — Green Clean |
|---|---|---|
| 210 — Purpose | Why do we exist? | Eliminate indoor toxins; make healthy homes the standard |
| 220 — Positioning | Why should customers choose us? | The indoor health protection company |
| 230 — Values | How do we behave to make that real? | Transparency, health accountability, environmental integrity |
Values operationalize purpose. Purpose without values is a mission statement. Values without purpose are a list of adjectives. Together, they create a brand that behaves consistently — not just communicates consistently.
Statements for self-assessment
Rate your agreement on a scale from −3 (completely disagree) to +3 (completely agree). There is no zero: the Marketing Canvas forces a directional position on every dimension.
Note on Detailed Track scoring: if averaging sub-question scores produces a mathematical zero, the method rounds to −1. A split score means the dimension is not clearly helping your goal — and "not clearly helping" requires the same investigation as "hurting."
Interpreting your scores
Negative scores (−1 to −3): Your values lack clarity, real-world demonstration, or both. The likely result: customers cannot feel what the brand stands for; differentiation is thin; trust erodes at scale. Values exist on paper. They do not drive behaviour.
Positive scores (+1 to +3): Your values are defined, demonstrated, and recognisable to both internal and external audiences. Employees can name them without reading a card. Customers can feel them without reading the About page. Values are functioning as a strategic operating system, not a communications asset.
Case study: Green Clean
Green Clean is a fictional eco-friendly residential cleaning service used as the recurring worked example throughout the Marketing Canvas Method.
Score: −2 to −1 (Weak) Green Clean lists sustainability, health, and transparency as values on its website. But internally, no decision references them. A supplier offering a cheaper ingredient with an ambiguous safety profile was approved without review. The marketing team uses "eco-friendly" language but has never commissioned an independent assessment. Employees can quote the values from the careers page; they cannot point to a decision shaped by any of them. The values pass the wall-art test and fail the behaviour test. Customers who investigate feel the gap immediately.
Score: +1 to +2 (Developing) Green Clean's values have started shaping behaviour in some areas. The proprietary non-toxic formula reflects the health value in a tangible way. B-Corp certification demonstrates environmental integrity beyond self-declaration. But consistency is uneven: the Family Health Report is in development but not yet live; a recent pricing decision was made on margin grounds alone, without evaluating alignment with the transparency value. Values are functional in product decisions. They are not yet operational in commercial decisions.
Score: +2 to +3 (Strong) Green Clean's values — transparency, health accountability, environmental integrity — are operationalised across all decision categories. The Family Health Report shows customers the exact toxin load avoided during each visit. A distribution partnership was declined because the partner's own products contained ingredients Green Clean's values prohibit. Pricing is tiered so cost-sensitive customers can access the service without the brand diluting its health standards to compete on price. When asked to name a decision made because of a value, the whole team gives the same three examples without prompting. The values are functional. They are felt before they are read.
Connected dimensions
Values does not operate in isolation. Four dimensions connect most directly:
210 — Purpose: Values operationalize purpose day-to-day. Purpose is the why. Values are the how. Without values, purpose remains abstract and impossible to audit.
240 — Visual Identity: Visual identity expresses values visually. A brand that claims transparency but uses opaque, complex design sends a contradictory signal. Identity must match the stated values or the disconnect becomes visible.
320 — Emotions: Values create emotional trust. The emotional connection customers form with a brand is rooted in their sense that the brand shares and lives their values — not in features or price.
340 — Proof: Behaviour proves values are real. Certifications, third-party audits, published reports, and verifiable commitments are how values cross the line from stated to demonstrated. Without proof, values are a claim. With proof, they are a competitive advantage.
Conclusion
The difference between a brand with values and a brand that posts values is a single question: what decision did you make because of them?
If the answer comes quickly and specifically — a supplier declined, a campaign revised, a partnership turned down — values are load-bearing. If the answer requires a search through recent memory and produces only vague examples, values are decorative.
The Marketing Canvas scores this dimension because values are not a culture matter or an HR matter. They are a strategic matter. In commodity markets, they are the last remaining differentiator. In experience markets, they are the foundation of tribal loyalty. In any archetype where brand identity drives purchasing, a weak score on 230 is a Fatal Brake — it blocks every other investment until it is fixed.
Sources
Patrick Lencioni, "Make Your Values Mean Something", Harvard Business Review, July 2002 — hbr.org
Kantar, BrandZ Most Valuable UK Brands 2024, Kantar, 2024 — kantar.com
Kantar, "Three questions to identify your brand's strategic priorities for 2025", Kantar, 2025 — kantar.com
Marketing Canvas Method, Appendix E — Dimension 230: Values, Laurent Bouty, 2026
About this dimension
Dimension 230 — Values is part of the Brand meta-category (200) in the Marketing Canvas Method. The Brand meta-category contains four dimensions: Purpose (210), Positioning (220), Values (230), and Visual Identity (240).
The Marketing Canvas Method is a complete marketing strategy framework built around 6 meta-categories, 24 dimensions, and 9 strategic archetypes. Learn more at marketingcanvas.net or in the book Marketing Strategy, Programmed by Laurent Bouty.
Hack: Marketing Canvas and Triple Bottom Line
As Marketers, we are not excused for being complaisant with the world around us. It should have been always the case but today the situation is so critical that we need to take action.
REVISIT STEP 2 - SET YOUR GOAL
The original approach at Step 2 was profit oriented. Indeed, during this step, we recommend to set a financial goal (revenue) before starting step 3 which is the assessment.
The triple bottom line approach (wikipedia) as proposed by John Elkington consists of extending the bottom line concept with sustainable elements. In addition to Profit, Elkington proposed to add Planet and People. The Marketing Canvas Method can be easily hacked for integrating the Triple Bottom Line concept by simply changing the way Goals are set during step 2.
HOW?
At Step 2, you can define goal for Profit (original approach) but also goal for Planet and People. It is not fully clear for me whether a standard framework exists with clear KPIs linking Marketing Strategy and Planet/People elements. You can chose the goals that would specifically work for you when discussing Planet and People topics. Based on a very quick desk research, I identified few topics that could be used for defining objectives for Planet and People. It would be interesting to have your point of views and make this list more robust. Don’t hesitate to comment this post.
LIST OF GOALS FOR PEOPLE AND PLANET
Energy Management: How could you reduce your energy consumption and use more renewable energy when executing your marketing strategy? Goal?
Resource Management: How could you make use of resources for your marketing strategy in such a way that our next generation or in future there are no effects on the resource? Goal?
Waste Management: How could you collect, transport, process or dispose of, manage and monitor various waste materials generated by your marketing strategy? Goal?
Employee Welfare: How could you reinforce employee welfare when executing your marketing strategy? Goal?
Fair Trade: How could you reinforce fairness in your marketing strategy through dialogue, transparency and respect, that seeks greater equity in international trade? Goal?
Cause Marketing: How can you better the society while executing your marketing strategy? Goal?
PROCESS
When you have defined these goals (e.g. CO2), you can apply the Marketing Canvas Method for assessing your current situation (STEP 3). Let’s take 2 examples from the 24 dimensions.:
JOB TO BE DONE (CUSTOMERS): Is the knowledge of your customers’ job to be done helping you from achieving your goals?
FEATURES (VALUE PROPOSITION): Are the features of your value proposition helping you achieve your goals?
By asking these questions, you have interesting discussions about your current ability to achieve these goals (like CO2) or not (Brake or Accelerator).
NEW TEMPLATE
Le Marché dans le Marketing Canvas
Dans l’enthousiasme de travailler sur sa stratégie marketing, on se précipite souvent et oublie l’importance de ce que je considère comme la première étape: la compréhension du marché dans lequel nous allons opérer (startup) ou nous opérons déjà (entreprise existante). Il y a 3 questions importantes à se poser lorsqu’on analyse le marché. C’est questions sont: …
Dans l’enthousiasme de travailler sur sa stratégie marketing, on se précipite souvent et oublie l’importance de ce que je considère comme la première étape: la compréhension du marché dans lequel nous allons opérer (startup) ou nous opérons déjà (entreprise existante).
Les questions qu’il faut se poser sont les suivantes:
Comment définir le marché?
Comment mesurer le marché?
Comment qualifier le marché?
Comment définir le marché?
Bien que la question puisse paraître simple et évidente, elle ne l’est pas.
Petit exemple: dans quel marché TESLA a-t-il décidé de se lancer avec son modèle S? La majorité des voitures électriques avant TESLA se situait dans un marché d’acheteurs urbains avec des petits déplacements. TESLA a privilégié le marché du luxe et plus particulièrement le marché des voitures sportives luxueuses dont la référence est … Porsche. En choisissant le marché, certaines constantes sont fixées telles que: le prix moyen (100k€ pour une voiture de sport de luxe) ou certaines caractéristiques clés du marché (performance, design, vitesse, …).
Comme illustré dans mon exemple, le marché conditionne certaines hypothèses de départ. On peut bien sur être un game changer et redéfinir ces règles toutefois elles restent pour l’acheteur un cadre de référence qu’il va utilisé pour comparer votre produit (lorsque vous louez une chambre chez AirbnB, vous comparez votre achat à une location dans un hotel, un gite ou un bed & breakfast).
Bien qu’il existe de nombreuses définitions d’un marché, celle que je préfère vient de Bill Aulet [1]. Il définit le marché en 3 règles:
Les clients dans le marché achètent tous des produits similaires.
Les clients dans le marché ont le même cycle d’achat et s’attendent à ce que les produits fournissent de la valeur d’une façon similaire.
Il y a du bouche à oreille entre les clients d’un même marché.
La première question est donc: Dans quel marché comptez-vous opérer?
Comment mesurer le marché?
Après avoir défini le marché dans le lequel vous allez opérer, il faut essayer de le mesurer afin de définir son potentiel et votre ambition. Une méthode provenant encore de l’entrepreneuriat s’appelle le TAM (pour Total Available Market), SAM (pour Serviceable Available Market) et SOM (Serviceable Obtainable Market) .
Derrière ces acronymes, ce cache des concepts assez simples:
Le TAM correspond au marché total possible. Si on prend l’exemple de Airbnb cela correspondrait à toutes les locations de chambres dans le monde pour une année.
le SAM correspond à la partie du marché où vous êtes actif (ou allez être actif si vous lancer votre activité). Le passage du TAM au SAM dépend de vos critères: géographique (là où vous êtes actifs), type de produit (ioS ou Android, premium ou cost), ...
le SOM est votre objectif en part de marché. Combien de % du SAM voulez vous obtenir?
la seconde question est donc: quelle est la taille du marché ?
Comment qualifier le marché?
Finalement, il vous reste à qualifier le marché. Qu’est ce que cela veut dire? Le marché a une vie et est dynamique comme un organisme vivant (il apparaît, grandit, se stabilise puis décline). Si vous ne comprenez pas l’etat du marché SAM dans lequel vous entrez, vous risquez de mal définir votre stratégie commerciale (le volume des ventes diffère entre chaque état).
Source: Wikipedia
La description ci-dessous provient de Wikipedia (https://fr.wikipedia.org/wiki/Cycle_de_vie_(commerce))
Stade de lancement: Introduction du produit sur le marché
coûts élevés de production et de développement
faible volume de vente
pertes pour l'entreprise
prix élevés
Stade de croissance
coûts réduits par les économies d'échelles
croissance importante des volumes de vente
profits croissants pour l'entreprise et marges élevées
prix assurant une large part de marché
début de simplification du marché: les grandes entreprises achètent les PME innovantes
Stade de maturité
marges réduites, disparition des compétiteurs incapables d'économies d'échelle (absorption, retrait, faillite, oligopoles, stabilisation des parts de marché)coûts de production faibles, mais coûts de promotion commerciale et de services à la clientèle élevés
maximum des volumes de vente
forte sensibilité à la conjoncture
profits encore très importants mais stagnants
fortes segmentations : les gammes de produits se sont diversifiées pour répondre à une demande exigeante
tendance à la baisse des prix en raison de la concurrence
anticipation de produits de remplacement par la recherche et le développement
Stade de déclin
diminution des ventes
diminution des profits
diminution des prix
apparition de produits de remplacement
La dernière question est: quel est l’état du marché ?
Conclusion
En répondant à ces 3 questions clairement, vous aurez plus facile lorsque vous définirez votre stratégie commerciale. L’étape suivante dans l’exercice du Marketing Canvas est de définir la compétition.
Référence
Bill Aulet, Disciplined Entrepreneurship : 24 Steps to a Successful Startup, John Wiley & Sons (30 août 2013)
Cycle de vie, Wikipedia
Marketing Canvas - Ambition
Dans le cadre d'une Marketing canvas, il est important de démarrer le processus à partir d'une question claire et simple basée sur l'ambition que vous souhaitez atteindre à l'aide de votre stratégie marketing. Une vidéo simple pour expliquer ce concept.
Marketing Strategy for Millennials from Marketing Cloud
Interesting Infographic from Marketing Cloud proposing 5 steps to creating your Marketing Strategy for Millennials. As you might have noticed, I am advocating the use of the Marketing Canvas for designing your Marketing Strategy. Let's check whether these steps fit into the process?
- Step 1 is definitely a no-brainer. Data and customer knowledge will help you to be very specific when discussing canvas. Dimensions like Humans (if you want to uncover key insights and customer preferences), Journey (if you want to design great customer experience), Value proposition (if you want to design the most relevant offers) and conversation (if you want to be at the right place, right time with the right subject) will help you.
- Step 2 is clearly identified in the canvas: Channel (in Journey), Content & Stories (Conversation), Media (Shared and Earned) and finally the global topic of conversations.
- Step 3 is also covered in Engagement (word of mouth), Influencers (Conversations), Proofs (Value Proposition) and Moment of Truth (Journey)
- Step 4 mentions that technology is key for millennials. It is true and it will influence preferred Channels (Journey), Media (Conversation) and Features (Value Proposition) but don't forget that Job To Be Done is why they engage with you and what problem they are trying to solve.
- Step 5 is all about your Purpose (Brand) and Listening (conversation). I am not a fan about education as I believe we don't educate customers but we engage them.
The conclusion is that the Marketing Canvas fits perfectly with these steps and can be applied for Millennials. Finally, I would like to mention that in the Budget dimensions, they are 2 important topics (capabilities and people) where you should invest for having the required tools and skills in your company if you want to do all of this.
More on Marketing Cloud: https://www.salesforce.com/products/marketing-cloud/best-practices/millenial-marketing-strategy/
3 Cs in a Digital World
Interesting article from Roland Berger Consultants about Sales in a Digital World. Their thesis is that you need to master 3 Cs if you want to have a voice in this new world:
- Develop the Customer Base: It is definitely in line with what I am preaching. You should not only focus on acquisition but also on stimulation and retention. The CLV dimension of the Marketing Canvas is telling you how much you perform versus your ambition;
- Orchestrate the Channel: I also agree but I would extend this to Orchestrate the Customer Journey as it is much broader than channel and it is integrating elements like Brand experience, touch-points, emotions and wow moments.
- Manage the complexity: it is maybe fluffy as notion. We all know that we should manage the complexity, the question is how should I do that. One possible answer is in the article when they discussed centralisation. I think the key element there is to automate your processes (BPM, scripting, algorithms, ...) in order to reduce the chaos and uncertainty. but don't forget to keep the human part.
Source: Roland Berger, Think Act, The digital future of B2B sales
Marketing Canvas, some tips about the process
Canvas works really well if:
- Start with a clear ambition, S.M.A.R.T. and linked with the finance. One of the usual mistake when doing a marketing strategy exercise is to not properly link the marketing actions with the financial consequences. In the Marketing Canvas exercise, we genuinely start from the financial ambition for addressing this issue. This ambition is about growth and thus the canvas is about growth hacking your marketing strategy.
- Start with a clear persona representing a customer cluster sharing the same Job To Be Done (problem to be solved by your offer). It could happen that you can't achieve your ambition with your current persona/segment (in classical strategy, it corresponds to a cash cow or a future dog). If it is the case you should consider another segment with another job to be done.
- Assess the current situation of your marketing mix by asking the 28 questions as defined in the canvas. Define clearly if each dimension TODAY is helping you to achieve your ambition (it is an accelerator) or is not (then we define this dimension as a brake). Do this exercise in team as it will create a shared understanding of the situation and support your answers with facts.
- Backward thinking is a very powerful way of finding solutions to any problem. In this process, try to visualise/imagine how dimension(s) defined as BRAKES would look like if they would help you with your ambition. What is different? Could you describe it? Does it really help with your ambition? If yes, then you have one idea of potential solutions. Find as many ideas as possible.
- Having generated plenty of ideas (some could even be yellow ideas aka impossible ideas), you should prioritise it in order to finalise your preferred vision of this future where your ambition is achieved. What are the actions you should do to transform this future into a reality: Start Doing, Stop Doing, Do More, Do Less, Simplify, Magnify? Brainstorm as a team and list all actions.
You now have identified all actions for building your future but you have to organise it into a comprehensive and feasible roadmap. Some actions are low hanging fruits while others require more time and effort. One way to do this is to use these 2 criteria: contribution to the ambition and effort. Congratulations, you now have a roadmap and a marketing strategy.
Why you need a bold question for your Marketing Strategy?
What is the best way to start defining the marketing strategy of your company, business or activity? My proposal is to start with a bold strategic question! Why?
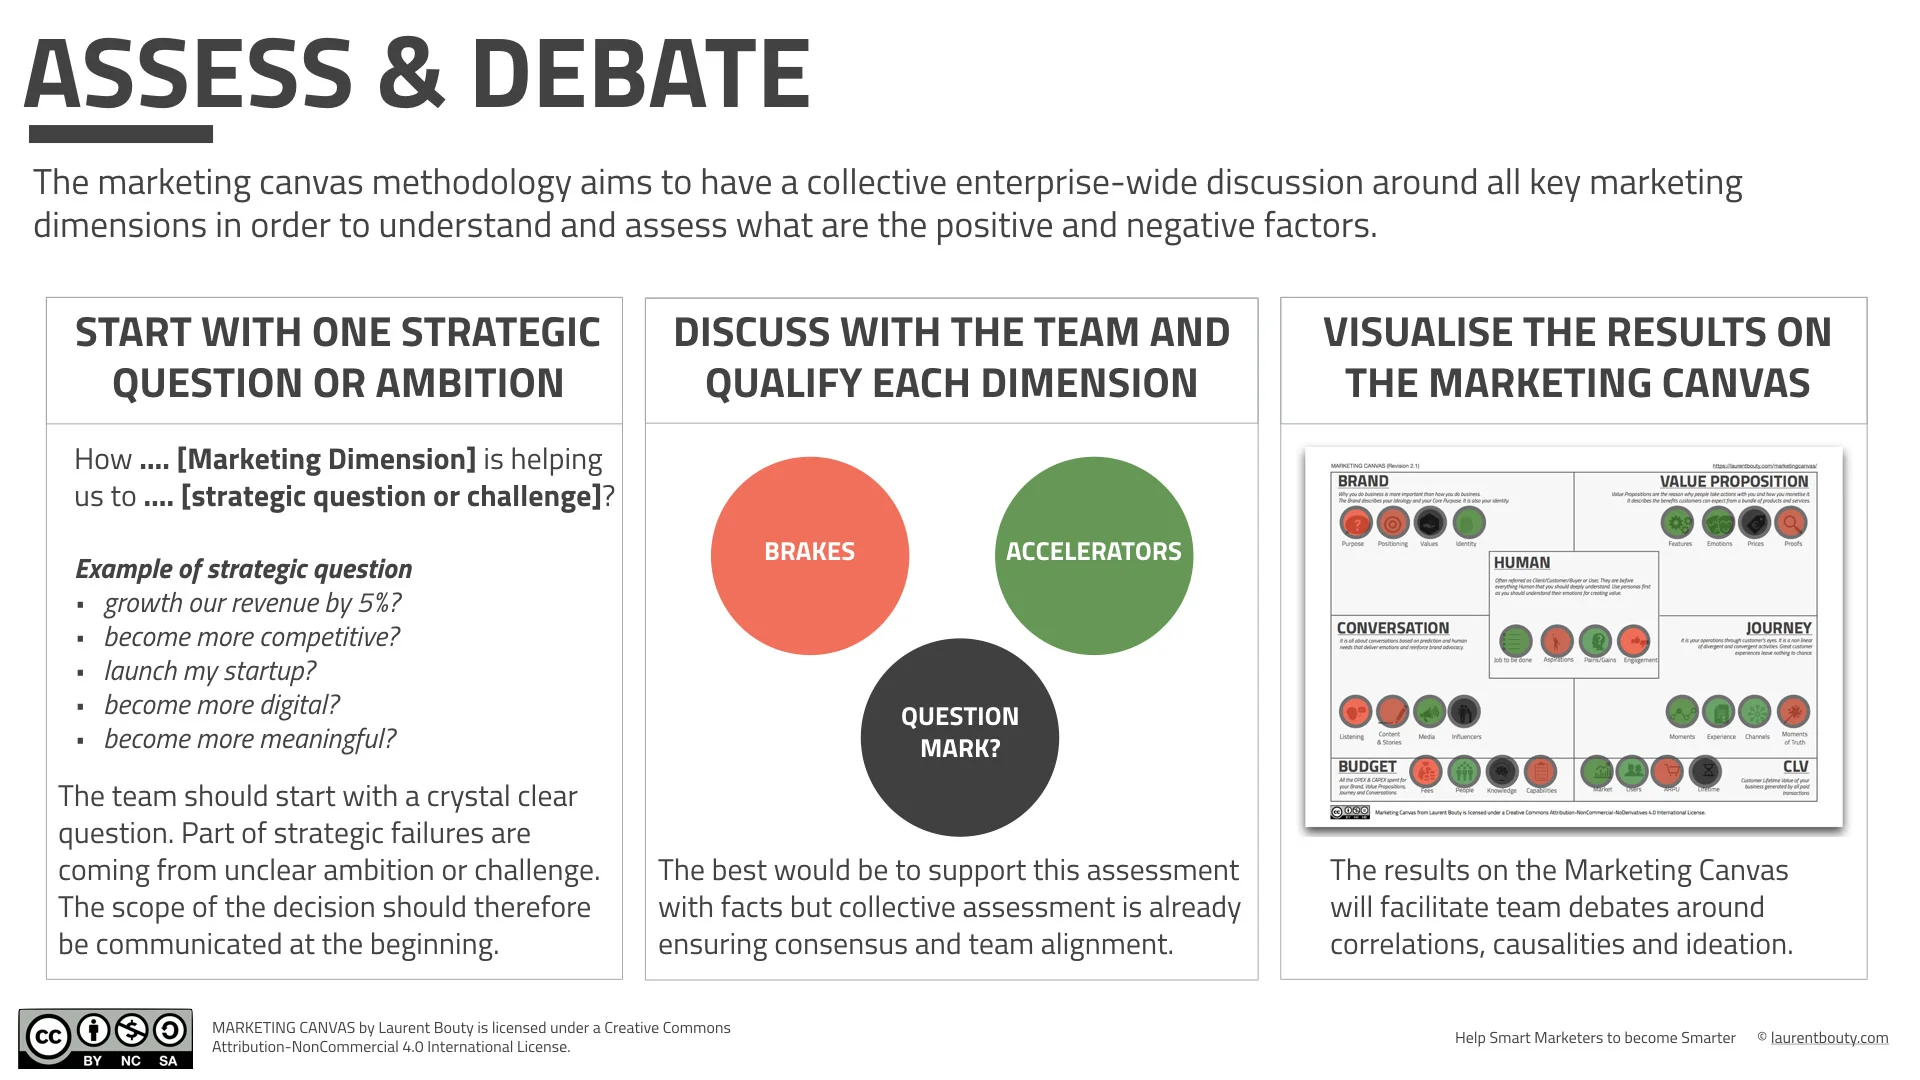
Because the objective of your strategy is to achieve an ambition and most probably a financial ambition. Whether you are a startup or a stock listed company, you have to achieve a financial ambition if you want to stay in business. Thus first hypothesis is to have a financial ambition and preferably S.M.A.R.T. one.
Financial Ambition of Your Strategy
Then let's imagine, you don't do any strategy and you let the business in free wheel (no plan). Most probably you will face problems and situations (external or internal) that will block you to achieve your ambition. I suggest that you highlight the biggest problem, your #1 fear for your business. Thus second hypothesis is that you need to define your biggest fear as the context where you will do your strategy.
Biggest commercial fear you have
Question
HOW CAN I (FINANCIAL AMBITION) IN (TOP #1 FEAR) ?
Examples
HOW CAN I GROWTH MY REVENUE BY 5% IN AN AUTOMATED AND DIGITAL ENVIRONMENT? (Shoe Store)
HOW CAN I PROTECT MY REVENUE NEXT YEAR IN A MARKET WHERE UBER IS ARRIVING? (Taxi company)
HOW CAN I BE PROFITABLE AFTER 1 YEAR IN A MARKET WHERE NOBODY KNOWS ME YET ? (Startup company)
Quote
Marketing Strategy should start with a bold question
How To Define Your Commercial Plan for Your Startup with Marketing Canvas?
When you work on your commercial strategy for your startup, you can facilitate this conversation with using the Marketing Canvas (more on the canvas here). Please find below 10 steps you should follow:
KEY QUESTIONS TO BE ASKED
What is your goal? Big Idea? Define a question that will clarify your projected future like How can we achieve 1M€ after one year of operation? How can we generate 5% growth next year? How can we differentiate our brand in a digital world where predictive technologies driven by AI will become a standard?
What is the problem you are trying to solve? Clarify the job to be done for your customers.
Who is our buyer and user? Define your persona.
If not you who else? Define the category where you are playing and what are the alternatives for your buyer.
How do you want to be remembered? What people will say about you? Your BRAND
What is your answer to the problem your buyer has? What is your value proposition? Do you have USP, ESP, Clear Pricing and Proofs?
What experience people will have with you? Will it generate sales and engagement? JOURNEY
How do you discuss with your buyer? Do you have conversations? Do you listen? Do you have content, stories, influencers? Which media do you use?
Does it make any financial sense? What is your Marketing Budget and Revenue?
If you don't think it all works, iterate one more time
PROCESS FOR ZERO APPROACH
As a startup, you should define your strategic hypothesis. It is slightly different than an existing business because you are starting from a white page.
Part 1- Target, Positioning
Define your key customer target (JTBD, ASPIRATION, PAINS & GAINS). As you are starting your business, you have no information on ENGAGEMENT.
Define your Brand strategy (PURPOSE and POSITIONING) and explain how you will differentiate your brand versus competitors. Explain what could be the VALUES of this brand and your IDENTITY strategy.
Define your Value Proposition (FEATURES, EMOTIONS and PRICING). Describe core, differentiated and unique features/emotions to support your Brand Strategy, matching your customer target and helping you to achieve your financial objectives. Do you have any PROOFS supporting your value proposition?
Part 2- Go To Market
Define your go to market approach and more specifically: Describe funnel journey (pre and post purchase) for your go to market: MOMENTS, EXPERIENCE, CHANNEL and MAGIC. Don't forget to align this with your brand strategy.
Describe your conversation strategy for your go to market. LISTENING, CONTENT, MEDIA and INFLUENCERS if any.
Part 3 - Metrics
Define your hypothesis in terms of metrics for your business: ACQUISITION (speed of acquisition), ARPU (average spending for each customer on the 12 months), LIFETIME (your churn assumption) and BUDGET (amount of € needed for supporting your strategy).
ASSESS YOUR ZERO APPROACH WITH YOUR TEAMS
Use the canvas and answer to these questions using all dimension while asking the same question:
Will my .... help me to achieve my goal?
RED: Not at all; GREEN: Definitely
Visualise your Commercial Strategy on Marketing Canvas
RED dimension must be reviewed or mitigated because that are not helping you to achieve your goal.
Interested in the Marketing Canvas, you can find more information here.
Resources
Startup Failure Rate Statistics To Take In [2020] - https://hustlelife.net/startup-failure-rate-statistics/
Steve Blank - Startup Tools - https://steveblank.com/tools-and-blogs-for-entrepreneurs/

