BLOG
A collection of article and ideas that help Smart Marketers to become Smarter
Marketing Canvas - Pricing
Pricing errors run in both directions. Underpricing signals low quality and leaves margin on the table. Overpricing creates resentment no feature list can fix. Dimension 330 of the Marketing Canvas scores whether your pricing actively supports your positioning — or quietly contradicts it.
About the Marketing Canvas Method
This article covers dimension 330 — Pricing, part of the
Value Proposition meta-category. The Marketing Canvas Method structures
marketing strategy across 24 dimensions and 9 strategic archetypes.
Full framework reference at
marketingcanvas.net →
·
Get the book →
In a nutshell
Prices (dimension 330) scores whether your pricing strategy reflects the value you deliver, aligns with customer willingness to pay, and supports your positioning. The foundational question is not "is the price low?" It is: does the customer perceive more value than the price asks, relative to alternatives?
That reframing is the entire point of treating pricing as a strategic dimension rather than a finance function. Price is not just a revenue variable — it is a signal. It communicates quality, confirms positioning, and either reinforces or contradicts everything else in the value proposition.
In the Marketing Canvas, Prices sits within the Value Proposition meta-category alongside Features (310), Emotions (320), and Proof (340). It is the dimension that makes the value proposition credible or exposes it as overclaimed.
Pricing errors run in both directions
The most common framing of a pricing problem is "our price is too high." The canonical view is more demanding: pricing errors run symmetrically in both directions, and both are strategically damaging.
Overpricing creates a gap between perceived value and cost that even strong features cannot bridge. When price exceeds what customers perceive as justified by the value, the result is not premium positioning — it is resentment, abandoned trials, and word-of-mouth that damages rather than builds.
Underpricing is equally problematic and more often overlooked. A price that is too low signals low quality and leaves margin on the table. It undermines positioning — a brand that claims "indoor health protection" at commodity pricing sends a contradictory signal. Customers use price as a quality heuristic. A low price says: "we don't fully believe in what we built either."
The diagnostic question is not where the price sits in absolute terms. It is whether the customer perceives more value than the price asks, compared to every alternative they are considering. A €15 artisanal coffee is not expensive if the customer perceives it as worth €20. A €5 coffee is overpriced if the customer sees it as worth €3.
Score negative if pricing is set by finance without customer input, or if there is a disconnect between price and positioning. Score positive when pricing actively supports the strategic position and customers perceive fair value — not cheap, not resentment-inducing, but justified.
The price/positioning test
The sharpest diagnostic in dimension 330 is also the simplest:
A premium position with discount pricing creates cognitive dissonance. A value position with premium pricing creates resentment. The price must match the promise.
This test catches misalignments that are obvious once named but invisible in day-to-day operations. A B2B software company that positions itself as "enterprise-grade" but prices below mid-market confuses the procurement team — the price contradicts the claim. A cleaning service that positions itself as health-protection specialists but prices below the eco-follower in the market undermines its own differentiation before a customer conversation begins.
Run the test against your own positioning: if a prospect saw only your price — before any marketing, any features list, any proof — would the price itself reinforce or contradict your positioning? If it contradicts, dimension 330 requires attention regardless of what the rest of the value proposition delivers.
M8 and dimension 330: diagnosis vs. strategy
In the Marketing Canvas Method, pricing is measured twice — at different points in the process, for different purposes.
M8 (Perceived Price) is calculated in Step 1 (Strategic Context Mapping). It normalises your actual price per unit relative to the highest and lowest prices in your competitive set, producing a score from −12 (feels very cheap) to +12 (feels very expensive). M8 is the diagnosis: it shows where your brand sits on the customer's mental price scale before any strategic decisions are made.
Dimension 330 is scored in Step 3 (the Vital Audit). It scores whether your pricing strategy — how you set, communicate, and manage price — actively serves your Step 2 goal. M8 is the starting position. Dimension 330 is the question: are you managing it intentionally?
For Green Clean, M8 is +3.0 — slightly above mid-market, well below EcoPure at +12.0. That is a deliberate positioning choice: accessible enough to attract health-conscious families who cannot justify the premium leader, differentiated enough that "eco-follower" NatureFresh at −6.0 cannot compete on the same terms. Dimension 330 scores whether Green Clean has made that a strategic choice — informed by customer WTP research, aligned with their health-first positioning, and sustainable relative to their cost structure — or whether +3.0 is simply where they ended up.
The four pricing anchors
The Marketing Canvas scores dimension 330 against four sub-questions that together define whether pricing is strategic or accidental:
Value vs. alternatives (331): Does the customer perceive more value than the price asks, compared to the next best alternative? This is the core question. It requires knowing both your own perceived value (M9) and your competitors' — and understanding whether the price premium or discount relative to alternatives is perceived as justified.
Willingness to pay (332): Is the pricing strategy grounded in customer WTP research, not internal cost-plus assumptions? WTP is not what customers say they would pay in a survey. It is the revealed willingness — what they actually pay, what they pay for competitors, and where the price sensitivity curve breaks. WTP research requires customer interviews, competitive analysis, and price sensitivity testing. Without it, dimension 330 cannot score above +1.
Cost coverage (333): Does the price account for all costs associated with delivering the value proposition — including the hidden costs of service, support, onboarding, and relationship management that are routinely underestimated? A price that does not cover full costs is not a strategic choice. It is a delayed crisis.
Positioning alignment (334): Is the price consistent with brand positioning and category goals? This is the price/positioning test applied systematically. Premium positioning requires premium-range pricing. Value positioning requires price-accessible pricing. Misalignment here is not a pricing problem — it is a brand architecture problem that dimension 330 surfaces.
Prices in the Marketing Canvas
The canonical question
Does your pricing strategy reflect the value you deliver, align with customer willingness to pay, and support your positioning?
Prices appears in the Vital 8 of three archetypes in roles that reflect its strategic weight:
Primary Accelerator for A6 (Value Harvester): The Value Harvester is extracting maximum cash flow from an existing customer base. Pricing power — the ability to raise prices, introduce premium tiers, and increase ARPU without triggering churn — is the primary growth mechanism. For A6, dimension 330 is not defensive. It is the offensive lever. Every pricing improvement directly converts to margin.
Secondary Brake for A2 (Efficiency Machine): An Efficiency Machine competes on cost leadership. The pricing risk is margin erosion — the downward pressure of competitive price-matching that can turn cost leadership into a race to zero. Dimension 330 scores whether the pricing strategy protects the margin structure that makes efficiency sustainable. For A2, price must be low enough to win volume without being so low that the cost model collapses.
Secondary Brake for A8 (Niche Expert): For the Niche Expert, the ability to raise prices is the proof that expertise is real. A niche authority that charges the same as a generalist is signalling that the niche does not command a premium — which undermines the authority itself. Hermès raises prices 5–8% annually and the market absorbs it. That is not arrogance. That is a dimension 330 score of +3 demonstrating that the niche position is genuine.
Growth Driver for A2 and A8: In both, pricing optimisation — raising prices toward the WTP ceiling, introducing tiered offerings, or expanding into premium segments — is a direct revenue lever that does not require new customer acquisition.
Statements for self-assessment
Rate your agreement on a scale from −3 (completely disagree) to +3 (completely agree). There is no zero — the Marketing Canvas forces a directional position on every dimension.
Your value proposition is creating more value than the cost of the next best alternative for your customers.
Your pricing strategy is based on customer Willingness To Pay (WTP) for solving their problem.
Your pricing strategy takes into account all costs associated with delivering your value proposition.
Your pricing strategy is aligned with your brand positioning and your goals for the category.
Your pricing strategy encourages customers towards the most sustainable option available.
(Dimensions 331–334 + 335 in the Marketing Canvas scoring system)
Note on Detailed Track scoring: if averaging sub-question scores produces a mathematical zero, the method rounds to −1. A split score means the dimension is not clearly helping your goal — and "not clearly helping" requires the same investigation as "hurting."
Interpreting your scores
Negative scores (−1 to −3): Pricing is misaligned with customer WTP, disconnected from positioning, or set by cost and competitive reference alone. The likely result: either margin erosion (underpricing) or purchase friction and resentment (overpricing). Pricing is not functioning as a strategic asset.
Positive scores (+1 to +3): Pricing is grounded in WTP research, consistent with positioning, covers full costs, and actively reinforces the value proposition rather than contradicting it. Customers perceive the price as justified. The price/positioning test passes without qualification.
Case study: Green Clean
Green Clean is a fictional eco-friendly residential cleaning service used as the recurring worked example throughout the Marketing Canvas Method.
Score: −2 to −1 (Weak) Green Clean's price of $200 per visit was set by looking at EcoPure ($260) and splitting the difference with NatureFresh ($140). No WTP research was conducted. No customer was asked what they would pay for a service that could verifiably protect indoor health rather than just clean with eco products. The price covers costs — just. But it does not reflect the value premium Green Clean is attempting to claim. The health-first positioning demands a price signal that says "this is a specialist service, not a cleaning commodity." At $200 in a market where the eco-follower charges $140, the $60 premium is too modest to reinforce the category distinction and too large to be dismissed as rounding error. The price is caught between value and premium without committing to either. Pricing is set by cost and competitive reference, not by customer WTP or positioning logic.
Score: +1 to +2 (Developing) Green Clean has conducted basic WTP research — six customer interviews and a price sensitivity survey of 40 existing customers. The data suggests that health-conscious parents with children under 10 have a WTP ceiling of approximately $230 for a verified health-protection service, compared to $170 for a standard eco-cleaning service. This validates a $200 entry price as accessible to the primary segment. But the full pricing architecture is incomplete: there is no premium tier for customers who want quarterly indoor air quality testing, no subscription discount structure that rewards commitment, and no articulated reason in the sales conversation for why $200 reflects value rather than cost. The price is in the right zone. The strategy around it is not yet complete.
Score: +2 to +3 (Strong) Green Clean's pricing architecture is fully aligned with positioning and WTP evidence. The standard service at $200 is priced as the accessible entry to health-first home care — above the eco-follower (NatureFresh at $140) to reinforce the quality signal, below the premium leader (EcoPure at $260) to remain accessible to the early believer segment. A premium tier at $240 includes quarterly indoor air quality baseline testing — a feature that translates health-first positioning into a tangible deliverable and captures WTP from the highest-intent segment. An annual subscription at $185/visit rewards commitment while improving LTV. The sales conversation anchors the $200 price to the university-validated formula and third-party certifications — making the price a consequence of quality, not a financial decision. Customers who ask "why not NatureFresh for $140?" receive a specific answer about what the $60 buys. Churn is lower in the premium tier than in the standard tier — confirming that the pricing architecture is reinforcing, not diluting, loyalty.
Connected dimensions
Prices does not operate in isolation. Four dimensions connect most directly:
310 — Features: Features justify the price. A unique functional benefit — the only independently validated non-toxic formula in the region — is the justification for a price premium. Without a unique feature, premium pricing is a claim without a foundation.
220 — Positioning: Price must match position. The price/positioning test is the most direct connection between these two dimensions. Positioning defines the promise. Prices either confirms or contradicts it at the first moment of commercial truth.
340 — Proof: Proofs reduce price sensitivity. A customer who has seen the university validation data, the B-Corp certification, and the Family Health Report is less price-sensitive than one who hasn't. Proof shifts the perceived value upward, which expands the WTP range and makes the price feel justified rather than expensive.
620 — ARPU: Pricing directly drives revenue per user. Every pricing decision — entry price, premium tier, subscription structure, annual increase — translates directly into ARPU. Dimension 330 and dimension 620 should be reviewed together: the pricing architecture is the primary lever for ARPU improvement without requiring new customer acquisition.
Conclusion
Prices is the dimension that either validates or undermines everything else in the value proposition. A product can have a unique feature, a designed emotional benefit, and a compelling purpose — and a price that signals none of it is real.
The strategic discipline is not to price low enough to be accessible or high enough to be premium. It is to price at the level where the customer perceives the value as justified relative to alternatives — and to ensure that perception is managed actively, not left to whatever the market average happens to be.
The price/positioning test is the fastest audit available: premium position + discount price = cognitive dissonance. Value position + premium price = resentment. When the price matches the promise, dimension 330 is working. When it doesn't, everything upstream is harder.
Sources
Thomas Nagle, Georg Müller, The Strategy and Tactics of Pricing, Routledge, 6th edition, 2018
Hermann Simon, Confessions of the Pricing Man, Springer, 2015
Marketing Canvas Method, Appendix E — Dimension 330: Prices, Laurent Bouty, 2026
About this dimension
Dimension 330 — Prices is part of the Value Proposition meta-category (300) in the Marketing Canvas Method. The Value Proposition meta-category contains four dimensions: Features (310), Emotions (320), Prices (330), and Proof (340).
The Marketing Canvas Method is a complete marketing strategy framework built around 6 meta-categories, 24 dimensions, and 9 strategic archetypes. Learn more at marketingcanvas.net or in the book Marketing Strategy, Programmed by Laurent Bouty.
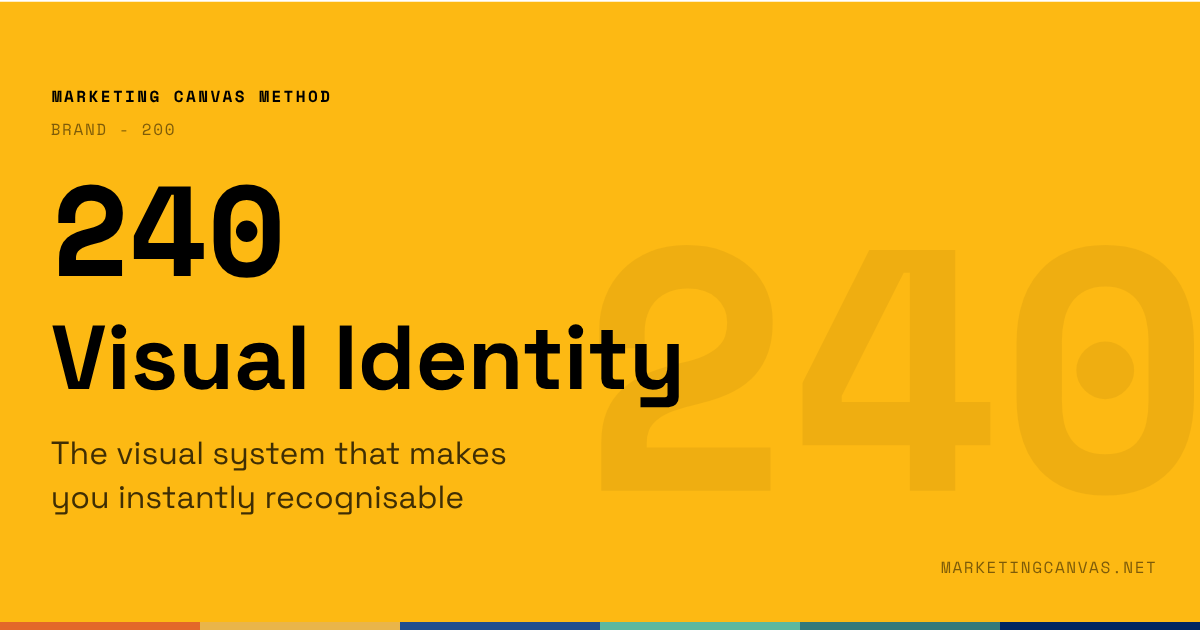
Marketing Canvas - Visual Identity
Visual identity is the only Brand dimension customers score before any interaction begins. The first impression formed from a colour, a typeface, or a photography style is a scoring event — rapid and largely subconscious. Dimension 240 of the Marketing Canvas applies four tests to determine whether what customers see matches what the brand stands for.
About the Marketing Canvas Method
This article covers dimension 240 — Visual Identity, part of the
Brand meta-category. The Marketing Canvas Method structures
marketing strategy across 24 dimensions and 9 strategic archetypes.
Full framework reference at
marketingcanvas.net →
·
Get the book →
In a nutshell
Visual Identity (dimension 240) is the visible expression of everything the brand stands for — logo, typography, colour, photography style, tone of voice, packaging, store design, digital experience. It is the layer customers actually see and touch.
Purpose, Positioning, and Values are internal architecture. Visual Identity is the façade that makes that architecture legible to the outside world. A brand can have a sharp purpose and clear values that customers never perceive, because the visual signals contradict or dilute them. Dimension 240 scores whether the visible layer matches the promise.
In the Marketing Canvas, Visual Identity sits within the Brand meta-category alongside Purpose (210), Positioning (220), and Values (230). It is the last of the four Brand dimensions — the one that translates all the others into something a customer can actually recognise.
What visual identity actually is
Visual identity is not just a logo. It is the complete system of signals that make a brand recognisable before a single word is read.
The most common failure in visual identity is not ugliness. It is inconsistency. A premium positioning with a budget-looking website creates cognitive dissonance. An innovation purpose with a conservative visual identity sends mixed signals. A sustainability-led brand using stock photography of white offices and generic smiling faces undermines its own story.
The Marketing Canvas tests Visual Identity against four questions — the same four that determine whether an identity is an asset or a liability:
Consistency — Does the brand feel the same across every touchpoint? Website, social media, packaging, sales presentations, email signatures, physical locations: the brand feeling should survive the channel change.
Alignment — Does the identity reflect Purpose, Positioning, and Values? A brand that stands for transparency should look transparent — open, legible, uncluttered. A brand that stands for premium craft should look handmade, not mass-produced.
Distinctiveness — Is the brand recognisable without the logo? This is the hardest test. Strip the logo from a social post, a packaging shot, a trade show stand. If the brand could belong to any competitor, distinctiveness is failing.
Likeability — Do target audiences find it appealing? Not universally appealing — strategically appealing to the specific people the brand is trying to reach.
Score negative when the brand looks different on social media than in stores, or when competitors' visual identities are interchangeable with yours. Score positive when someone encountering the brand in a new context — a trade show, a LinkedIn post, a delivery box — would recognise it instantly.
Visual identity in the Marketing Canvas
The canonical question
Is your brand instantly recognisable, and does what customers see reflect what you stand for?
Visual Identity appears in the Vital 8 of three archetypes — in different roles, for different strategic reasons:
Secondary Brake for A1 (Disruptive Newcomer): A disruptor entering a new market depends on being noticed and understood immediately. Rapid growth frequently outpaces identity coherence — different teams produce different materials, brand guidelines are informal, the visual language fragments. For A1, a weak Visual Identity score means the story isn't landing even when the product is right.
Secondary Brake for A7 (Scale-Up Guardian): The Scale-Up Guardian faces the same problem at higher speed. Hypergrowth across geographies, channels, and team sizes is the fastest way to dilute visual identity. The brand that looked coherent at 50 employees starts to splinter at 500. Protecting visual identity during scale is the A7 challenge — it requires governance, not just creativity.
Secondary Accelerator for A9 (Category Creator): A company creating a new market category faces a specific visual identity problem: customers cannot yet visualise what the category looks like. A distinctive, ownable visual identity helps customers recognise the new category before they fully understand it. Green Clean's visual shift — moving from generic eco-green to clinical-white-with-green-accents — signalled "health protection" rather than "cleaning products." The visual identity taught the category.
The four tools of visual identity
Visual identity is built from five core components. Each needs to be managed as part of a system, not designed in isolation:
Logo — The anchor of the system. Should be instantly recognisable, scalable from a favicon to a billboard, and capable of standing alone without a tagline. The logo is not the brand, but it is the most compressed expression of it.
Colour palette — The most powerful recognition tool. Colour increases brand recognition by up to 80% and is the first element processed in snap judgements. A primary colour and a disciplined secondary palette give the system range without incoherence. Proprietary colour ownership — the kind Tiffany has with its blue, or Hermès with its orange — is a competitive asset that takes years to build and seconds to dilute.
Typography — Fonts carry personality at a subconscious level. A modern sans-serif suggests clarity and accessibility. A refined serif suggests heritage and authority. Mixing type families without a clear logic produces visual noise. Most brands need two typefaces: one for display (personality), one for body (readability).
Imagery — Photography style, illustration conventions, graphic elements, and iconography. This is where most brands lose consistency first. When three different teams commission three different photographers with three different briefs, the imagery stops telling a single story.
Brand guidelines — The document that makes the system sustainable. Not a creative constraint — a consistency engine. Without guidelines, every new hire, agency, and market makes independent decisions that slowly fragment the identity.
Why consistency is a strategic imperative
Research consistently shows that visual consistency is not just an aesthetic preference — it is a commercial one.
Studies find that consistent branding across platforms can increase revenue by 33%, and that 73% of consumers trust a brand more when it presents a consistent visual identity. The Ehrenberg-Bass Institute found that products from high-cohesion brand portfolios achieve 17% higher brand recall than those from low-cohesion portfolios — a measurable commercial effect from visual discipline alone.
The mechanism is psychological: visual consistency is interpreted as reliability. A brand that looks the same everywhere signals that it behaves the same everywhere. Inconsistency, even subtle, reads as unprofessionalism or worse — as a brand that does not fully believe its own story.
Statements for self-assessment
Rate your agreement on a scale from −3 (completely disagree) to +3 (completely agree). There is no zero: the Marketing Canvas forces a directional position on every dimension.
Note on Detailed Track scoring: if averaging sub-question scores produces a mathematical zero, the method rounds to −1. A split score means the dimension is not clearly helping your goal — and "not clearly helping" requires the same investigation as "hurting."
Interpreting your scores
Negative scores (−1 to −3): Your visual identity lacks consistency, alignment, or distinctiveness — or all three. The likely result: customers cannot recognise the brand across contexts; the visual signals contradict the positioning; trust erodes because the brand looks different in different places. The identity is not working as a strategic asset.
Positive scores (+1 to +3): Your visual identity is consistent, aligned with purpose and values, distinctively ownable, and liked by the right audiences. The brand is recognisable without the logo. The visual layer makes the strategic promise visible and believable before a word is read.
Case study: Green Clean
Green Clean is a fictional eco-friendly residential cleaning service used as the recurring worked example throughout the Marketing Canvas Method.
Score: −2 to −1 (Weak) Green Clean's visual identity was assembled rather than designed. The website uses a stock photography library of forests and leaves. The social media uses bright greens and cartoonish icons. The service vehicle is plain white. The invoice template is a generic Word document. There is no logo consistency rule: the stacked version appears on the website, the horizontal version on vehicles, and a wordmark variant on the app. A customer encountering Green Clean on Instagram would not recognise them on a doorstep. The four tests all fail. Consistency: no. Alignment: no (the visuals say "eco" not "health"). Distinctiveness: no. Likeability: inconclusive because there is no unified identity to evaluate.
Score: +1 to +2 (Developing) Green Clean has developed a visual identity system connecting "health" and "home" — a palette of off-white, clean greens, and clinical blues that signals medical-grade standards rather than generic eco-friendliness. The logo exists in one canonical version. Photography guidelines specify real homes, real light, real people — not stock. But execution is uneven: the vehicles haven't been updated, the invoice template still looks generic, and two social media accounts use different colour proportions. The system exists. It is not yet fully applied.
Score: +2 to +3 (Strong) Green Clean's visual identity passes all four tests without effort. A customer who finds them on Instagram, receives their Family Health Report, sees their van outside a neighbour's house, and reads a local press feature would recognise the brand immediately across all four contexts — without seeing the logo in three of them. The off-white and clean-green palette is theirs. The photography style — natural light, visible ingredient labels, children in the background — is theirs. Every touchpoint looks like it was made by the same team with the same brief. The identity makes the positioning visible before a word is read.
Connected dimensions
Visual Identity does not operate in isolation. Four dimensions connect most directly:
220 — Positioning: Visual identity makes positioning visible. A brand positioned as "the indoor health protection company" needs a visual language that looks clinical and trustworthy — not naturalistic and decorative. If the identity contradicts the positioning, customers feel the dissonance even if they cannot name it.
230 — Values: Visual identity expresses values without words. A transparency value requires an open, uncluttered visual language. An environmental integrity value requires imagery that shows real commitment, not stock nature photography.
430 — Channels: Channels must carry visual identity consistently. A brand present across six channels that applies its identity differently in each one loses the cumulative recognition effect that makes visual identity commercially valuable.
520 — Stories: Stories are told through visual identity. The photography style, colour palette, and typographic voice are the container for every piece of content the brand produces. A weak visual system undermines strong storytelling — the message is right but the vessel dilutes it.
Conclusion
Visual Identity is the only Brand dimension that customers score for you before any interaction begins. The first impression formed from a logo on a van, a colour on a packaging shelf, or a typography choice on a social post is a scoring event — a rapid, largely subconscious assessment of whether this brand looks like one worth trusting.
The strategic imperative is not to look beautiful. It is to look consistent. A mediocre identity applied with total discipline across every touchpoint outperforms a brilliant identity applied inconsistently. Consistency is what turns recognition into trust, and trust is what turns visual identity from a design asset into a commercial one.
Sources
Cameron Chapman, "A Logo Is Not a Brand", Harvard Business Review, June 2011 — hbr.org
Marty Neumeier, The Brand Gap, New Riders, 2006 — amazon.com
Ward, Trinh, Beal, Dawes, Romaniuk, "Standing out while fitting in: Visual branding cohesion across a product portfolio", Journal of Marketing Management, Ehrenberg-Bass Institute, January 2025 — journals.sagepub.com
Marketing Canvas Method, Appendix E — Dimension 240: Visual Identity, Laurent Bouty, 2026
About this dimension
Dimension 240 — Visual Identity is part of the Brand meta-category (200) in the Marketing Canvas Method. The Brand meta-category contains four dimensions: Purpose (210), Positioning (220), Values (230), and Visual Identity (240).
The Marketing Canvas Method is a complete marketing strategy framework built around 6 meta-categories, 24 dimensions, and 9 strategic archetypes. Learn more at marketingcanvas.net or in the book Marketing Strategy, Programmed by Laurent Bouty.
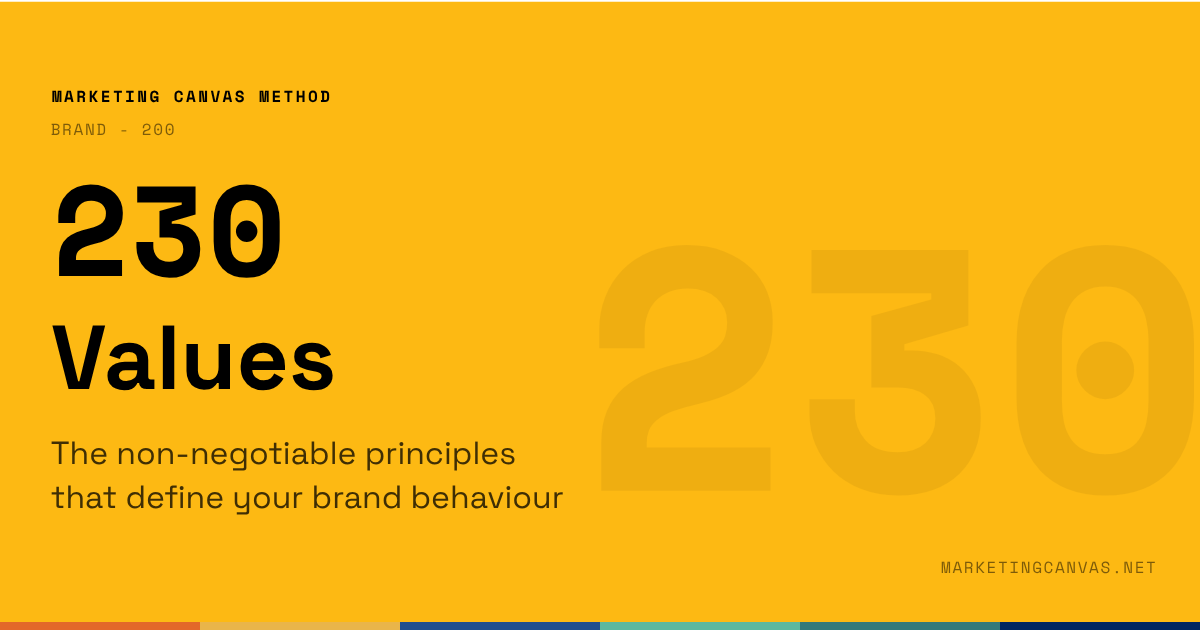
Marketing Canvas - Values
Most brands have values on a wall. Very few have values that change decisions. Dimension 230 of the Marketing Canvas scores the difference — and the acid test is a single question: can you name a decision made in the last year because of a stated value, even when a different decision would have been more profitable?
About the Marketing Canvas Method
This article covers dimension 230 — Values, part of the
Brand meta-category. The Marketing Canvas Method structures
marketing strategy across 24 dimensions and 9 strategic archetypes.
Full framework reference at
marketingcanvas.net →
·
Get the book →
In a nutshell
Values (dimension 230) are the core beliefs a brand would defend even when doing so is commercially costly. Not the list of adjectives on the careers page. The principles that visibly shape decisions — what the brand builds, who it hires, which partnerships it declines, which customers it turns away.
In the Marketing Canvas, Values sits within the Brand meta-category alongside Purpose (210), Positioning (220), and Visual Identity (240). If Purpose answers why we exist, Values answers how we behave. Purpose is the architecture. Values are the load-bearing walls that make it structurally sound — or expose it as a facade.
What values actually are
Most companies have values. Almost none of them are used.
The tell is simple. Ask three people on the leadership team to name the company's values without looking at a slide. Then ask them to name one decision made in the last twelve months that was made because of a stated value — a decision where the value-driven choice was harder or less profitable than the alternative.
If they can answer the second question, values are functional. If they cannot, values are decoration.
This is the acid test the Marketing Canvas applies to dimension 230: can you point to a specific decision in the past year that was made because of a stated value, even when a different decision would have been more profitable? A score of +2 or above requires a yes. Everything below that is still in progress.
Values are not aspirational. They are descriptive of current behaviour. "We aspire to be more transparent" is a goal. "We publish our ingredient list in full, even when competitors don't" is a value.
Values in the Marketing Canvas
The canonical question
Are your brand's values reflected in your behaviour and what you actually do?
Values is a Fatal Brake for two archetypes — the two where the absence of genuine values collapses the entire strategic logic:
A2 — Efficiency Machine: In a commodity market, customers need a reason not to feel embarrassed about their choice. Aldi's core value — smart shopping as intelligence, not compromise — reframes discount as a badge of sophistication. Without that value anchoring the positioning, Aldi is just cheap. The value is what makes cost leadership sustainable rather than a race to the bottom. For A2, values anchor the operational discipline that makes efficiency structural, not tactical.
A3 — Brand Evangelist: The tribe forms around shared values, not around products. Patagonia's 2011 "Don't Buy This Jacket" campaign — a full-page New York Times ad urging customers not to purchase unless they genuinely needed the product — only worked because the values were real. Any other company running that ad would have been called hypocritical. Patagonia's revenue increased. When values are authentic, they compound. For A3, values are the belief system. Without them, evangelism has nothing to evangelize.
The Harley-Davidson case illustrates what happens when values fail to evolve. Freedom and rebellion as expressed through loud heavyweight motorcycles resonated deeply with baby boomers. But values that are generationally locked are Fatal Brakes in slow motion. When the tribe's next generation defines freedom differently, the brand's values become a museum exhibit, not a compass. The failure wasn't operational. It was a Values (230) failure that the company tried to solve with a Features (310) answer — the LiveWire electric motorcycle. Wrong dimension, wrong diagnosis.
Values as differentiation
In markets where features converge, values become the last meaningful point of difference.
When two cleaning products perform identically, when two accounting software platforms offer similar functionality, when two airlines fly the same routes at comparable prices — the brand whose values align with the customer's identity wins. Not because the customer is irrational, but because identity is a real decision factor. People don't just buy what works. They buy what they want to be seen buying.
Kantar research confirms that in an increasingly volatile world, people want brands that can deliver on their promises and live up to their stated values. The implication is direct: values that are visibly lived are a competitive asset. Values that are stated but not demonstrated are a liability, inviting the cynicism that collapses trust faster than any product failure.
Research from Kantar's BrandZ study shows a clear link between brand strength and pricing power, with strong brands consistently commanding significantly higher prices than weaker ones. Values are a core input to that brand strength — they give customers a reason to choose that survives price comparisons.
Values vs. purpose vs. positioning
These three Brand dimensions are related but distinct. Conflating them produces vague strategy.
| Dimension | Question | Example — Green Clean |
|---|---|---|
| 210 — Purpose | Why do we exist? | Eliminate indoor toxins; make healthy homes the standard |
| 220 — Positioning | Why should customers choose us? | The indoor health protection company |
| 230 — Values | How do we behave to make that real? | Transparency, health accountability, environmental integrity |
Values operationalize purpose. Purpose without values is a mission statement. Values without purpose are a list of adjectives. Together, they create a brand that behaves consistently — not just communicates consistently.
Statements for self-assessment
Rate your agreement on a scale from −3 (completely disagree) to +3 (completely agree). There is no zero: the Marketing Canvas forces a directional position on every dimension.
Note on Detailed Track scoring: if averaging sub-question scores produces a mathematical zero, the method rounds to −1. A split score means the dimension is not clearly helping your goal — and "not clearly helping" requires the same investigation as "hurting."
Interpreting your scores
Negative scores (−1 to −3): Your values lack clarity, real-world demonstration, or both. The likely result: customers cannot feel what the brand stands for; differentiation is thin; trust erodes at scale. Values exist on paper. They do not drive behaviour.
Positive scores (+1 to +3): Your values are defined, demonstrated, and recognisable to both internal and external audiences. Employees can name them without reading a card. Customers can feel them without reading the About page. Values are functioning as a strategic operating system, not a communications asset.
Case study: Green Clean
Green Clean is a fictional eco-friendly residential cleaning service used as the recurring worked example throughout the Marketing Canvas Method.
Score: −2 to −1 (Weak) Green Clean lists sustainability, health, and transparency as values on its website. But internally, no decision references them. A supplier offering a cheaper ingredient with an ambiguous safety profile was approved without review. The marketing team uses "eco-friendly" language but has never commissioned an independent assessment. Employees can quote the values from the careers page; they cannot point to a decision shaped by any of them. The values pass the wall-art test and fail the behaviour test. Customers who investigate feel the gap immediately.
Score: +1 to +2 (Developing) Green Clean's values have started shaping behaviour in some areas. The proprietary non-toxic formula reflects the health value in a tangible way. B-Corp certification demonstrates environmental integrity beyond self-declaration. But consistency is uneven: the Family Health Report is in development but not yet live; a recent pricing decision was made on margin grounds alone, without evaluating alignment with the transparency value. Values are functional in product decisions. They are not yet operational in commercial decisions.
Score: +2 to +3 (Strong) Green Clean's values — transparency, health accountability, environmental integrity — are operationalised across all decision categories. The Family Health Report shows customers the exact toxin load avoided during each visit. A distribution partnership was declined because the partner's own products contained ingredients Green Clean's values prohibit. Pricing is tiered so cost-sensitive customers can access the service without the brand diluting its health standards to compete on price. When asked to name a decision made because of a value, the whole team gives the same three examples without prompting. The values are functional. They are felt before they are read.
Connected dimensions
Values does not operate in isolation. Four dimensions connect most directly:
210 — Purpose: Values operationalize purpose day-to-day. Purpose is the why. Values are the how. Without values, purpose remains abstract and impossible to audit.
240 — Visual Identity: Visual identity expresses values visually. A brand that claims transparency but uses opaque, complex design sends a contradictory signal. Identity must match the stated values or the disconnect becomes visible.
320 — Emotions: Values create emotional trust. The emotional connection customers form with a brand is rooted in their sense that the brand shares and lives their values — not in features or price.
340 — Proof: Behaviour proves values are real. Certifications, third-party audits, published reports, and verifiable commitments are how values cross the line from stated to demonstrated. Without proof, values are a claim. With proof, they are a competitive advantage.
Conclusion
The difference between a brand with values and a brand that posts values is a single question: what decision did you make because of them?
If the answer comes quickly and specifically — a supplier declined, a campaign revised, a partnership turned down — values are load-bearing. If the answer requires a search through recent memory and produces only vague examples, values are decorative.
The Marketing Canvas scores this dimension because values are not a culture matter or an HR matter. They are a strategic matter. In commodity markets, they are the last remaining differentiator. In experience markets, they are the foundation of tribal loyalty. In any archetype where brand identity drives purchasing, a weak score on 230 is a Fatal Brake — it blocks every other investment until it is fixed.
Sources
Patrick Lencioni, "Make Your Values Mean Something", Harvard Business Review, July 2002 — hbr.org
Kantar, BrandZ Most Valuable UK Brands 2024, Kantar, 2024 — kantar.com
Kantar, "Three questions to identify your brand's strategic priorities for 2025", Kantar, 2025 — kantar.com
Marketing Canvas Method, Appendix E — Dimension 230: Values, Laurent Bouty, 2026
About this dimension
Dimension 230 — Values is part of the Brand meta-category (200) in the Marketing Canvas Method. The Brand meta-category contains four dimensions: Purpose (210), Positioning (220), Values (230), and Visual Identity (240).
The Marketing Canvas Method is a complete marketing strategy framework built around 6 meta-categories, 24 dimensions, and 9 strategic archetypes. Learn more at marketingcanvas.net or in the book Marketing Strategy, Programmed by Laurent Bouty.