M5: How to Size Your Market and Know If Your Goal Is Realistic
In a Nutshell
M5 · Step 1 · Market DNAM5: Market Sizing
"The potential volume."
M5 quantifies the opportunity in your M1 category using two figures: the theoretical ceiling (TAM) and the realistic target (SAM). A third derived figure — your Current Share — is the baseline that makes your Step 2 revenue goal either mathematically honest or visibly overreaching.
Most companies know their revenue. Few know their market share. And without market share, your revenue target is not a goal — it is a number you chose because it felt ambitious enough to write down.
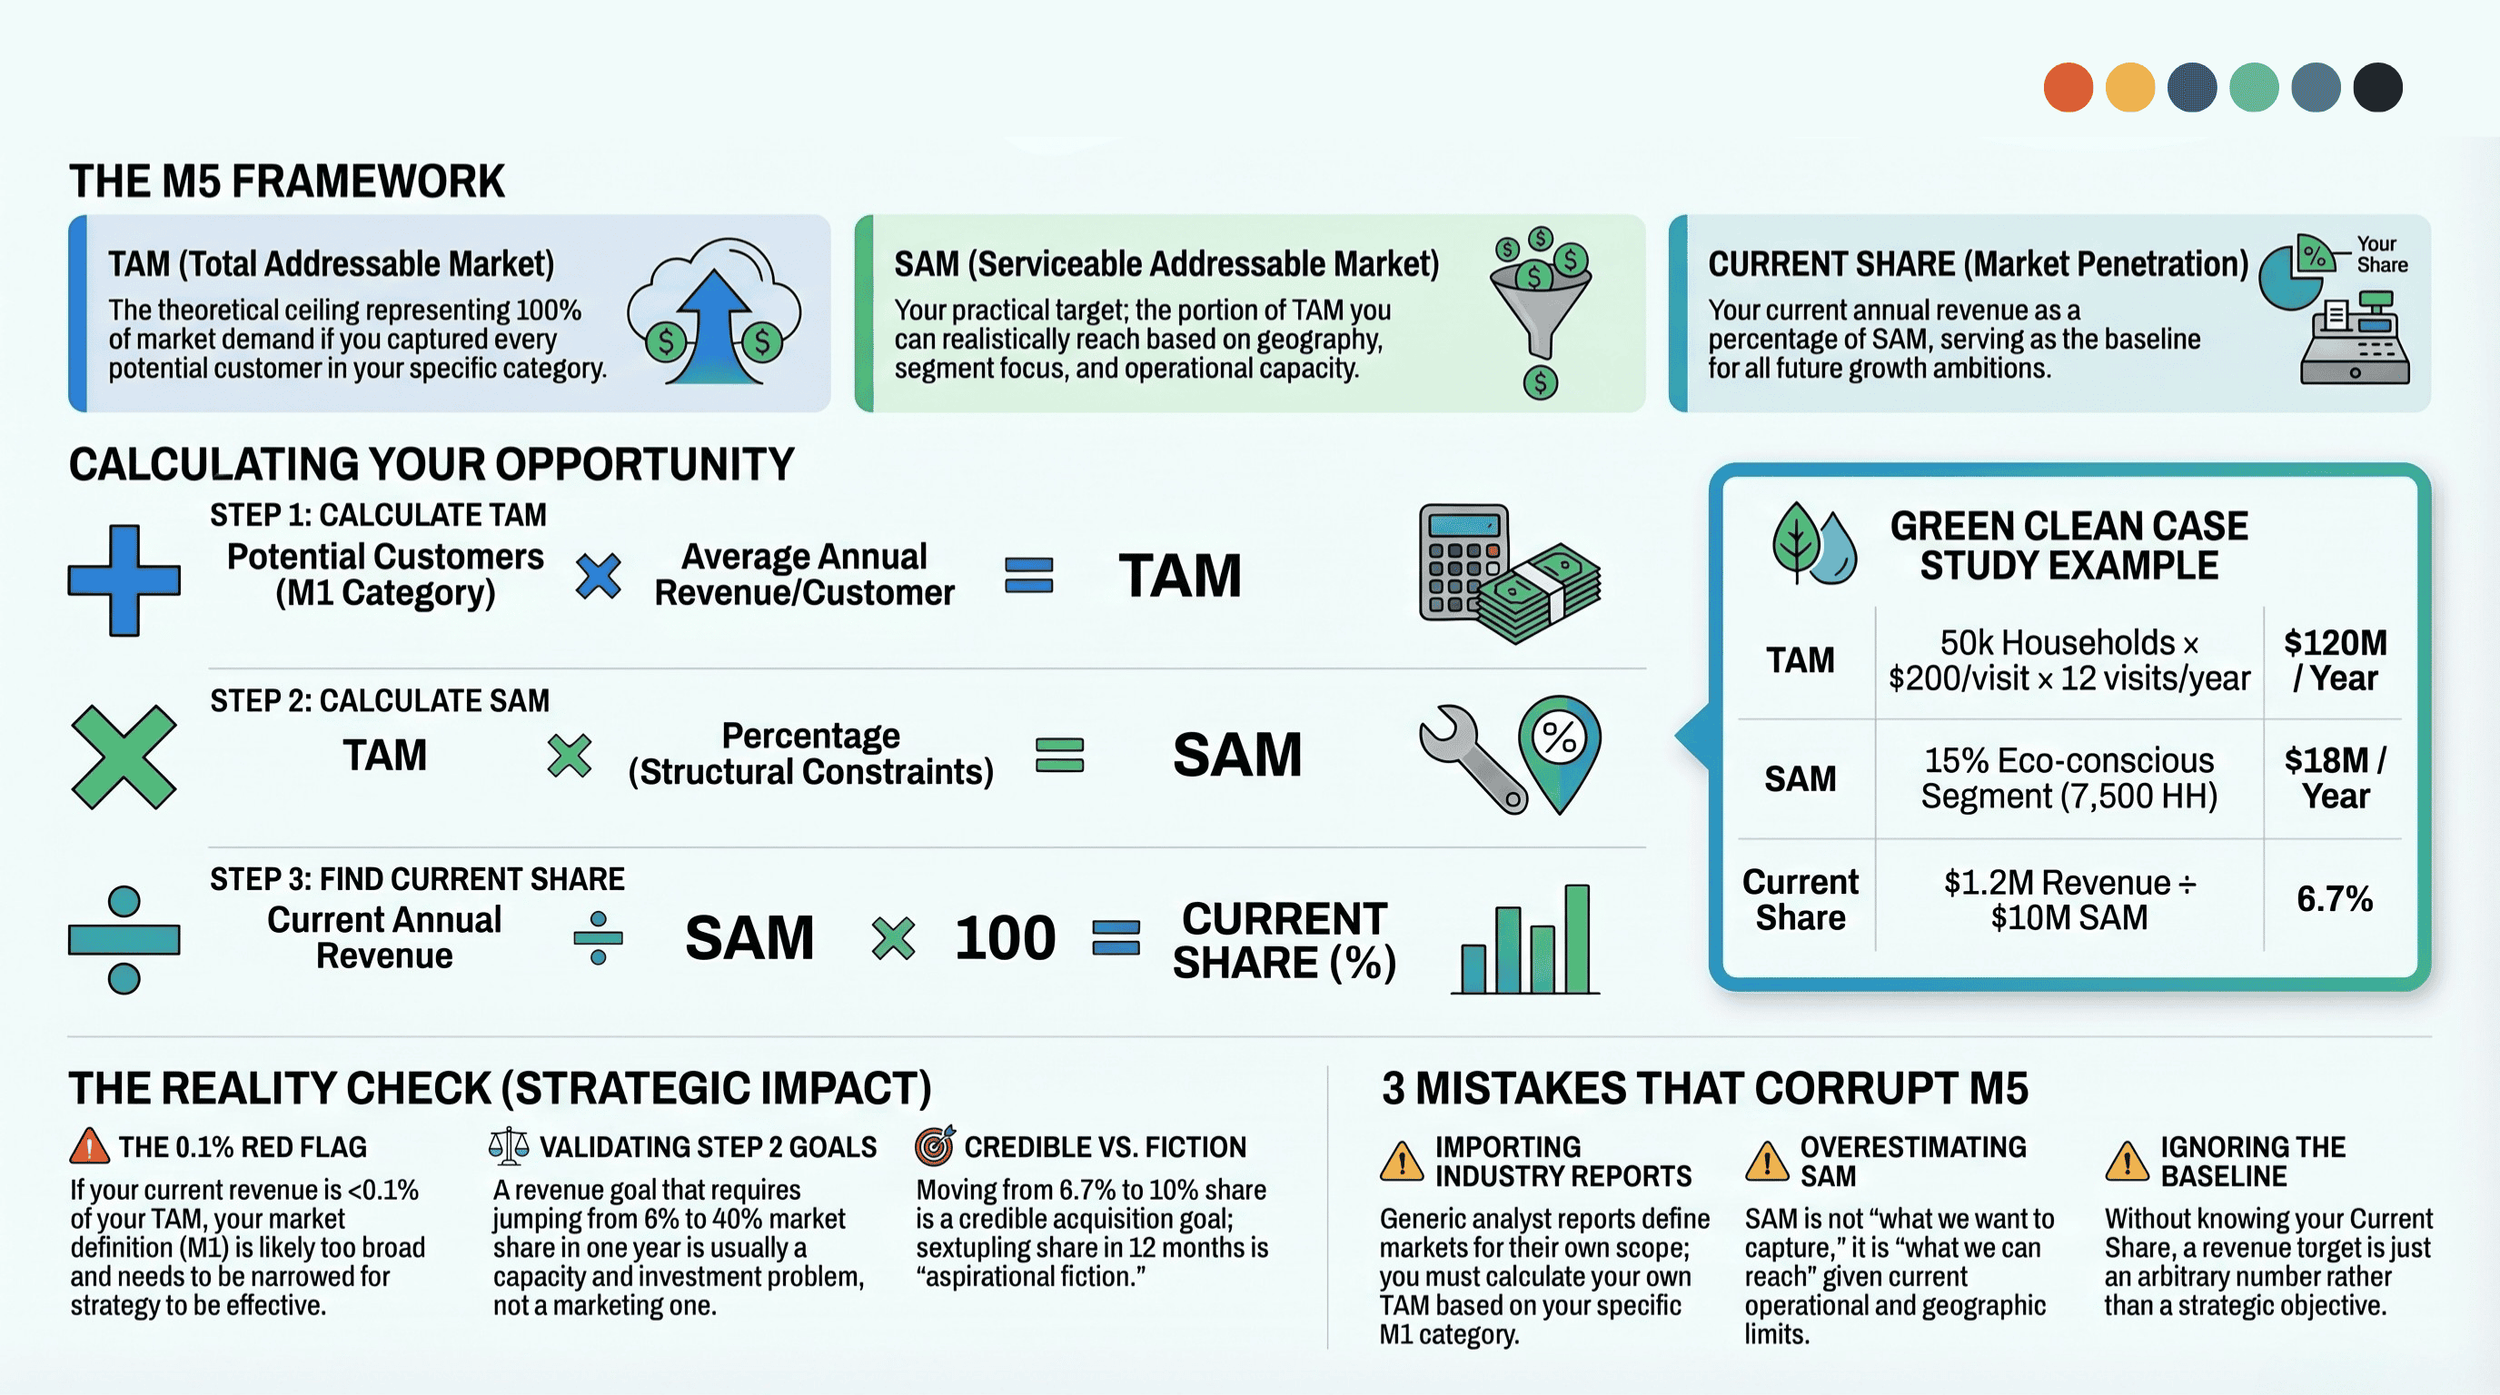
M5 (Market Sizing) is the Marketing Canvas Method parameter that converts market definition into a quantified opportunity. Its catchphrase is "the potential volume." It gives you the ceiling — how large the opportunity is — and a baseline — how much of it you currently hold. Together, those two numbers make your Step 2 revenue goal either mathematically honest or visibly overreaching.
M5 is the fifth and final parameter in Step 1's Market DNA cluster, after M1 (Market Definition), M2 (Key Benefits), M3 (Growth Curve), and M4 (Economic Value). It is the parameter that turns the qualitative picture built by M1–M4 into a number.
The Two Metrics: TAM and SAM
M5 uses two figures, not one.
TAM — Total Addressable Market is the total revenue opportunity in your M1 category if you captured 100% of demand. It is a theoretical ceiling. No company captures 100% of its market, but TAM establishes the outer boundary of what is possible and anchors every subsequent estimate.
SAM — Serviceable Addressable Market is the portion of TAM you can realistically reach and serve given your current model, geography, segment focus, and operational capacity. SAM is your practical target. Your goal in Step 2 is set against SAM, not TAM.
The third figure — Current Share — is not always listed as a separate metric, but it is the one that makes M5 strategically useful. Knowing your SAM is $18M tells you the ceiling. Knowing you currently hold 6.7% of it tells you what a realistic 12-month ambition looks like.
| Metric | Definition | Strategic role |
|---|---|---|
| TAM Total Addressable Market | Total revenue in your M1 category if you held 100% market share | Ceiling — the outer boundary of what is possible |
| SAM Serviceable Addressable Market | The portion of TAM you can realistically reach and serve given geography, segment, and capacity | Target — the arena your Step 2 goal is set against |
| Current Share Market Penetration | Your current annual revenue as a percentage of SAM | Baseline — shows where you start and how much room exists |
How to Calculate TAM and SAM
The formulas are straightforward. The discipline is in applying them to your M1 category specifically — not to a broader industry that happens to include your product.
TAM formula:
TAM = Number of potential customers × Average annual revenue per customer
SAM formula:
SAM = TAM × % of the market you can realistically reach or serve
The SAM percentage is where honest judgment is required. It is not "the percentage we'd like to capture" — it is the structural constraint on your reach: your geography, your segment definition, your price point relative to the market, your current distribution capacity.
Current Share:
Current Share (%) = Your current annual revenue ÷ SAM × 100
Applied: Green Clean
Green Clean is an eco-friendly residential cleaning service in a metro area. Its Lead Segment — eco-conscious urban homeowners, dual-income, ages 35–55 — was defined in Step 0. Its M1 category is eco-friendly residential cleaning services in the metro region.
Here is its full M5:
| Metric | Calculation | Value |
|---|---|---|
| TAM | 50,000 households × $200/visit × 12 visits/year | $120M / year |
| SAM | 15% eco-conscious segment ≈ 7,500 households × $200 × 12 | $18M / year |
| Current Share | $1.2M revenue ÷ $18M SAM × 100 | 6.7% |
| Reading | 6.7% penetration in a growing $18M SAM — meaningful room for acquisition before the market matures | |
Reading this output: Green Clean operates in an $18M serviceable market and currently holds 6.7% of it. That penetration rate tells you several things immediately. Growing from 6.7% to 10% within 12 months is a credible Acquisition goal — it requires capturing roughly 500 additional households in a segment that is growing. Growing from 6.7% to 40% in the same period is not — it would require the company to nearly sextuple its market share in a year, which no amount of marketing spend can deliver without also addressing delivery capacity, hiring, and operational infrastructure. M5 makes the difference between those two goals visible before the strategy is written.
Marketing Canvas Method: M5 Framework
Why M5 Is Only Valid If M1 Is Correct
M5 calculates the size of your M1 category. If M1 is wrong, M5 is wrong — and wrong in a predictable direction: it will be too large.
A company that defines its M1 as "the software market" instead of "project management tools for construction firms" will calculate a TAM in the hundreds of billions. That number is technically accurate for the software industry. It is useless for strategy. The SAM derived from it will be an equally inflated fiction, and any Step 2 goal set against it will be disconnected from the company's actual competitive position.
The test: run the TAM formula using your M1 category definition. If the resulting TAM is so large that your current revenue represents less than 0.1% of it, one of two things is true: either you are genuinely in a very early stage of a massive market (rare), or your M1 is too broadly defined (common). Go back to M1 before proceeding.
Three Mistakes That Corrupt M5
Mistake 1 — Using an industry report TAM instead of calculating your own. Industry analysts define markets for their own purposes — coverage scope, investment narrative, research methodology. Their TAM definition almost never matches your M1. An analyst report on the "global cleaning products market" includes industrial, commercial, and residential segments across all geographies and all product types. Green Clean's TAM is residential, eco-friendly, one metro region. Use the formula. Do not import a number from a report without checking whether it uses your M1 definition.
Mistake 2 — Setting SAM too high by underestimating structural constraints. The most common SAM error is applying the Lead Segment percentage to the full potential population without accounting for what the business can actually serve. Green Clean's 15% eco-conscious segment figure comes from market research on consumer values in the region. But if Green Clean can only dispatch cleaners within a 30km radius, the SAM should reflect that geographic constraint, not the entire metro area. SAM is the realistically reachable opportunity — "reachable" has operational as well as demographic dimensions.
Mistake 3 — Ignoring current share when setting Step 2 goals. Current Share is the anchor that makes M5 strategically useful. A company with 2% current share in a mature market has a very different strategic situation from a company with 2% current share in a fast-growing market. In the first case, gaining 3 percentage points of share requires either significant competitive displacement or waiting for natural churn. In the second case, 3 additional points may be achievable simply by keeping pace with category growth. Always calculate Current Share. It is the number that makes your goal honest.
◆ Practitioner's Tip
The number that immediately exposes an unrealistic goal
Before I let a team move to Step 2, I ask them one question: what is your current market share? Almost no one knows the answer precisely. But the estimate they produce — combined with the SAM they just calculated — tells me everything about whether their Step 2 goal is grounded or aspirational fiction.
A company with €800K revenue in a €10M SAM holds 8% share. If they want to grow to €1.2M next year, that is 12% share — a 4-point gain. Achievable with focused execution. If they want to reach €4M, that is 40% share in 12 months. That is not a marketing strategy problem — it is a capacity and investment problem that no amount of brand work will solve. M5 makes that visible in 30 seconds.
The second thing I check is whether the SAM was calculated from the M1 category or from a broader industry number someone found in a report. If a B2B software company with €2M revenue claims a SAM of €500M, I ask them to show me the calculation. Almost always, the €500M comes from an analyst report defining a market five times broader than their actual competitive arena. Their real SAM — calculated from their M1 — is usually €20–40M. That changes every number downstream.
If current share is < 0.1% of TAM → either early-stage hypergrowth or M1 is too broad.
Always build SAM from your M1 formula — never import it from an industry report.
| Metric | Definition | Strategic Role |
|---|---|---|
| TAM Total Addressable Market |
Total revenue in your M1 category if you held 100% market share | Ceiling — shows the outer boundary of the opportunity |
| SAM Serviceable Addressable Market |
The portion of TAM you can realistically reach and serve given geography, segment, and capacity | Target — the arena your Step 2 goal is set against |
| Current Share Market Penetration |
Your current annual revenue as a percentage of SAM | Baseline — shows where you start and how much room exists to grow |
| Metric | Calculation | Value |
|---|---|---|
| TAM | 50,000 households × $200/visit × 12 visits/year | $120M / year |
| SAM | 15% eco-conscious segment ≈ 7,500 households × $200 × 12 | $18M / year |
| Current Share | $1.2M current revenue ÷ $18M SAM × 100 | 6.7% |
| Strategic reading | 6.7% penetration in a growing $18M SAM — significant room to grow with focused acquisition | |
How M5 Feeds Step 2
M5's SAM and Current Share figures travel directly into Step 2 (Revenue Ambition & Goal Setting). They provide two specific inputs:
The ceiling test: Is my Step 2 revenue target achievable within my SAM? A target that implies more than 30–40% market share in a single year is a structural impossibility in most markets, regardless of strategy quality.
The penetration baseline: How ambitious is my target relative to current share? Moving from 6.7% to 8% of SAM is a focused acquisition play. Moving from 6.7% to 7% is maintenance. Moving from 6.7% to 15% in 12 months requires a step-change in acquisition capacity, not just better marketing. M5 makes the implicit explicit.
The goal you declare in Step 2 then triggers Archetype Selection alongside M3 and M4. The archetype determines your Vital 8 priorities in Step 3. Every number downstream of Step 1 depends on getting M5 right.
Run Your Own M5
You need three numbers to calculate your M5: the size of your Lead Segment within your M1 market, the average annual revenue per customer in that segment, and your current annual revenue. If you have those, the calculation takes five minutes.
If you are not certain of your M1 category definition before running M5, start with the M1+M2 article first. A wrong M1 produces a wrong SAM every time.