BLOG
A collection of article and ideas that help Smart Marketers to become Smarter
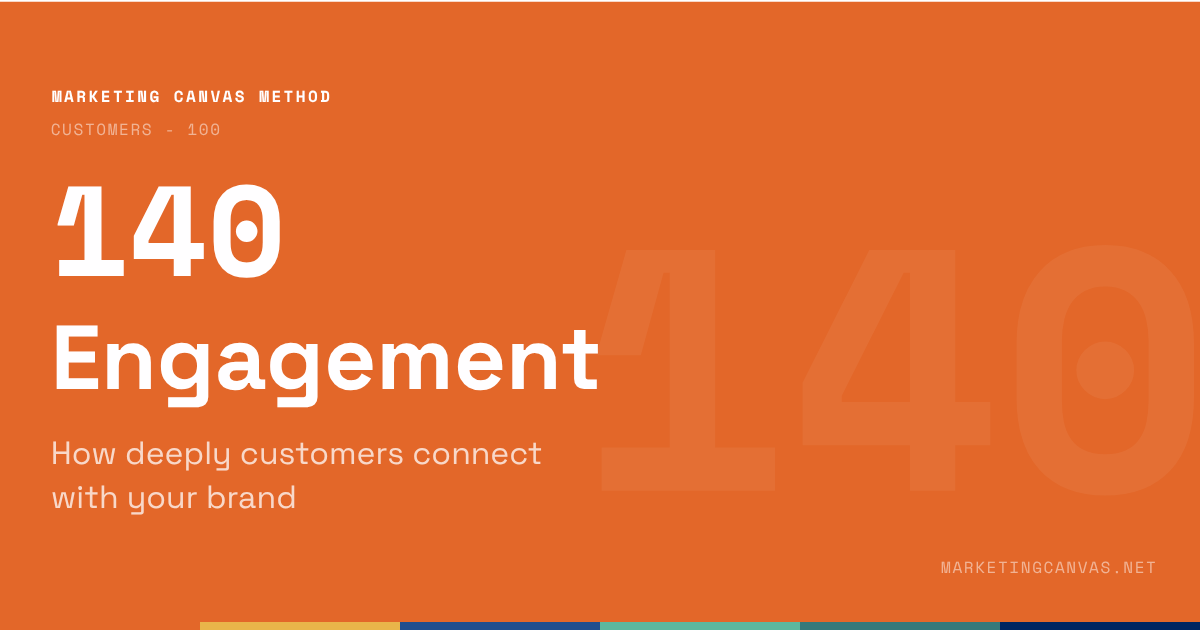
Marketing Canvas - Engagement
Satisfaction and engagement are not the same thing. A customer can score 7/10 on satisfaction and never return. Dimension 140 of the Marketing Canvas explains the difference, how to measure it, and why engagement is the leading indicator that predicts churn before it appears in the revenue line.
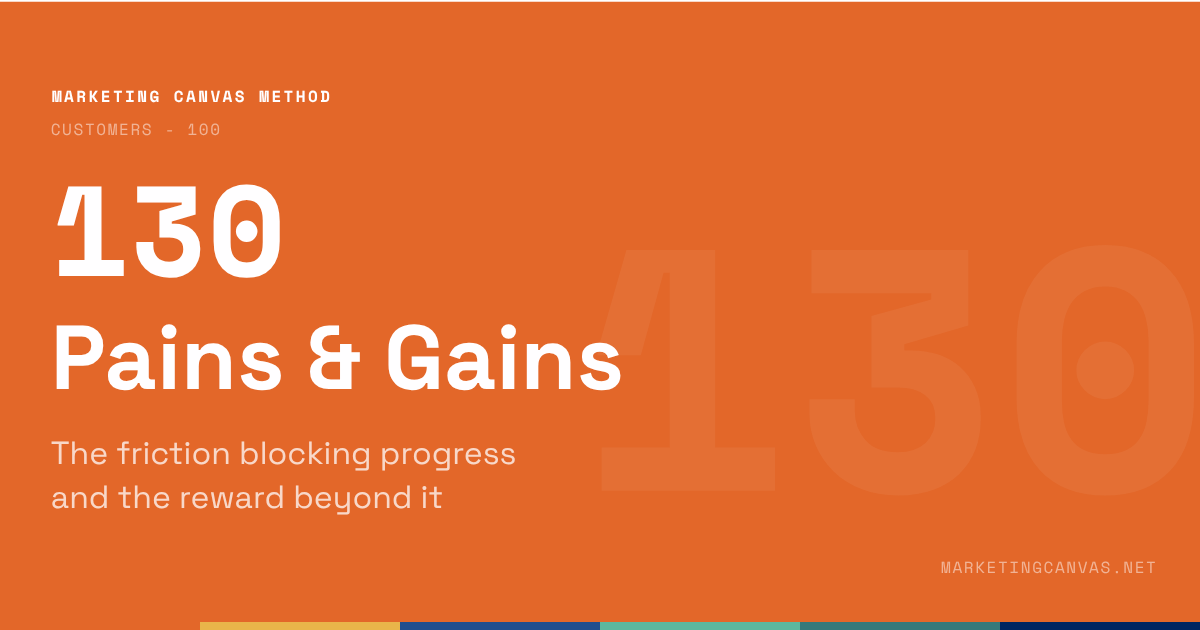
About the Marketing Canvas Method
This article covers dimension 140 — Engagement, part of the
Customers meta-category. The Marketing Canvas Method structures
marketing strategy across 24 dimensions and 9 strategic archetypes.
Full framework reference at
marketingcanvas.net →
·
Get the book →
In a nutshell
Engagement (dimension 140) measures the quality and depth of the relationship between brand and customer. Not satisfaction. A customer can be satisfied and completely disengaged.
That distinction is the entire point of this dimension. Satisfaction measures how a customer felt about the last interaction. Engagement measures whether the customer is actively participating in the relationship — recommending the brand unprompted, providing feedback, returning without being asked, defending the brand when challenged. These are different signals, and they require different interventions.
In the Marketing Canvas, Engagement sits within the Customers meta-category alongside Job To Be Done (110), Aspirations (120), and Pains & Gains (130). It is the last of the four Customer dimensions — and the one that translates everything upstream into a measurable, trackable relationship signal.
Engagement as a leading indicator of churn
The most commercially important insight in this dimension is also the least intuitive: engagement is a leading indicator of churn, while revenue is a lagging one.
Churn does not happen suddenly. It is preceded by a sequence of declining engagement signals — fewer referrals, slower response to outreach, silence where there used to be feedback, reduced product usage depth, a shift from promoter to passive. By the time churn appears in the revenue line, the customer made the decision weeks or months earlier. Companies that track engagement signals catch that decision in progress. Companies that track only revenue discover it after the fact.
Research consistently confirms this pattern. A 2025 analysis of customer engagement as a retention predictor found that engagement metrics — frequency of use, depth of feature adoption, responsiveness to outreach — signal churn risk before any revenue indicator does. Customers who begin ignoring key features are significantly more likely to churn; those who maintain consistent usage patterns, even at modest levels, renew at materially higher rates.
The practical implication for the Marketing Canvas: a company that scores Engagement at −1 is not just describing a weak customer relationship today. It is describing a churn problem that will show up in User Lifetime (630) figures within the next 6–12 months.
What engagement actually measures
Engagement is active participation. The four observable forms:
Recommendation — does the customer refer the brand to others without being asked? Unprompted referral is the strongest engagement signal because it requires the customer to put their own reputation behind the brand. Green Clean's 35% referral rate by 2024 was the clearest evidence of high engagement — customers were actively recruiting new ones.
Feedback — does the customer respond to outreach, complete surveys, attend review sessions, and provide input into product or service evolution? A customer who stops providing feedback is not neutral — they have disengaged. Silence is a signal.
Return without prompt — does the customer come back without a campaign, a discount, or a re-engagement effort? Repeat purchase driven by marketing spend is retention. Repeat purchase driven by habit and relationship is engagement.
Defence under challenge — does the customer defend the brand when it is criticised? This is the tribal signal. Customers who have moved from satisfied to engaged will tell a sceptical colleague "actually, here's why I use them" without being asked to.
The NPS instrument
The classic measurement tool for Engagement is the Net Promoter Score — a single question that segments customers into three groups based on their likelihood to recommend:
Promoters (score 9–10): actively recommend the brand to others. The growth engine. Every promoter generates acquisition at zero additional cost. The strategic goal is to grow this group and give them the tools to advocate effectively.
Passives (score 7–8): satisfied but not engaged. They stay until something better comes along or a pain accumulates. They do not recommend, but they do not damage the brand either. The strategic goal is to understand what would move them to promoter status.
Detractors (score 0–6): dissatisfied and potentially vocal. They represent churn risk and reputational risk simultaneously. The strategic goal is not to ignore them — detractor verbatims are the richest source of improvement intelligence in any customer base.
The NPS score itself (% Promoters − % Detractors) is useful as a tracking metric. What matters more in the MCM audit is the ratio between the two groups and whether the company has systems in place to act on what both groups are saying. A high NPS with no feedback loop is a number, not a strategy.
Score negative if engagement is unmeasured, or measured only through satisfaction surveys. Score positive when the company tracks promoter/detractor ratios, acts on the feedback, and can demonstrate a link between engagement scores and business outcomes.
Engagement in the Marketing Canvas
The canonical question
How deeply connected are your customers to your brand?
Engagement appears in the Vital 8 of three archetypes — and the roles span the full range of urgency:
Fatal Brake for A3 (Brand Evangelist): The Brand Evangelist archetype is built entirely on tribal belonging. If the tribe is not engaged, there is no tribe — just customers who happen to have bought the same product. Patagonia's NPS of 70+ and customer retention of 82% by 2022 are not incidental. They are the strategic output of an engagement system built around Worn Wear, environmental activism, and community events that make customers active participants rather than passive purchasers. For A3, a low Engagement score does not mean "improve the relationship." It means the entire archetype is failing.
Primary Accelerator for A4 (Stagnant Leader): A leader experiencing stagnation faces a leaky bucket — churn is rising while acquisition is fighting to refill it. Deepening engagement with the existing customer base is the primary defence. It is cheaper to re-engage a passive customer than to acquire a new one. It is far cheaper to convert a detractor's concern into product improvement than to lose them and acquire a replacement. For A4, Engagement is not a nice-to-have — it is the mechanism that slows the leak while the experience is being fixed.
Primary Accelerator for A7 (Scale-Up Guardian): Hypergrowth tends to destroy the relationships that created growth. As teams scale, as processes become standardised, as the personal touch disappears, early adopters shift from promoters to passives. The Scale-Up Guardian's specific challenge is maintaining engagement quality while growing volume. Tracking engagement signals during rapid growth is the early warning system that tells leadership whether the brand is scaling its relationship — or just scaling its revenue.
Statements for self-assessment
Rate your agreement on a scale from −3 (completely disagree) to +3 (completely agree). There is no zero — the Marketing Canvas forces a directional position on every dimension.
Note on Detailed Track scoring: if averaging sub-question scores produces a mathematical zero, the method rounds to −1. A split score means the dimension is not clearly helping your goal — and "not clearly helping" requires the same investigation as "hurting."
Interpreting your scores
Negative scores (−1 to −3): Engagement is unmeasured, or measured only through satisfaction surveys that don't distinguish between satisfied-and-disengaged and genuinely loyal. Detractors are not being systematically identified or addressed. Promoters are not being activated. Churn signals are invisible until they appear in the revenue line — by which point the decision has already been made.
Positive scores (+1 to +3): Engagement is tracked systematically through promoter/detractor ratios and behavioural signals. Detractor feedback feeds directly into service and product improvements. Promoters have tools and reasons to advocate. The company can demonstrate a measurable link between engagement scores and retention outcomes. Engagement is functioning as the leading indicator it is designed to be.Case study: Green Clean’s Engagement strategy
Misaligned understanding (-3, -2, -1): Green Clean lacks the tools to measure engagement and struggles to address customer dissatisfaction. Detractors outnumber promoters, harming the brand’s reputation, while sustainability efforts are absent from its engagement strategy.
Surface understanding (0): Green Clean uses basic tools like surveys but lacks a cohesive approach to managing detractors and empowering promoters. Sustainability is a peripheral concern, limiting its appeal to eco-conscious customers.
Deep understanding (+1, +2, +3): Green Clean leverages NPS and behavioral data to track engagement effectively. It proactively resolves detractor concerns, encourages promoters to share positive reviews, and integrates sustainability into its messaging, fostering strong customer relationships.
Case study: Green Clean
Green Clean is a fictional eco-friendly residential cleaning service used as the recurring worked example throughout the Marketing Canvas Method.
Score: −2 to −1 (Weak) Green Clean has no formal engagement measurement. The team sends an annual satisfaction survey — three questions, 22% response rate — and reads the results as confirmation that customers are happy. There is no NPS measurement. No promoter/detractor tracking. No system for capturing or acting on feedback between services. When a customer cancels, the cancellation is processed without any outreach to understand why. The churn rate of 20% in 2021 is treated as an industry benchmark issue, not an engagement signal. The team cannot name a single specific action taken in response to customer feedback in the past twelve months. Engagement is not measured. Engagement is not managed.
Score: +1 to +2 (Developing) By 2022, Green Clean has introduced NPS measurement after each service visit. They have identified a promoter group (score 9–10) representing 38% of customers, and a detractor group (score 0–6) representing 14%. The promoter group is being asked for referrals informally. The detractor group is contacted by the founder within 48 hours of a low score — a process that is recovering approximately 40% of those customers. A quarterly feedback session with a sample of long-term customers is feeding service improvements. But the system is still primarily reactive: engagement is being tracked, but not yet used as a leading churn indicator. The referral rate sits at 18% — growing, but not yet the dominant acquisition channel.
Score: +2 to +3 (Strong) Green Clean's engagement system is proactive and closed-loop. NPS is tracked after every service visit and monthly at the account level. Detractor verbatims are reviewed weekly and feed directly into the service improvement backlog — four product changes in 2023 traced directly to detractor feedback. Promoters receive structured advocacy tools: referral cards, a community group, and the option to share their Family Health Report data publicly with anonymisation. The referral rate reached 35% by 2024, making word-of-mouth the largest single acquisition channel. Churn fell from 20% to 12% between 2021 and 2024 — a decline that correlated directly with the improvement in NPS and the reduction in the detractor-to-promoter ratio. Engagement is the company's most reliable leading indicator of both retention and growth.
Connected dimensions
Engagement does not operate in isolation. Four dimensions connect most directly:
130 — Pains & Gains: Engagement drops when pains accumulate. The most reliable way to convert a promoter into a passive — or a passive into a detractor — is to leave a mapped pain unaddressed. Pains & Gains research identifies what to fix; Engagement measurement tracks whether fixing it is working.
510 — Listening (VOC): VOC systems feed engagement data. The feedback loop that makes engagement actionable requires a systematic listening infrastructure — not just NPS, but the full VOC stack that captures what customers say, where they say it, and at which stage of the journey.
630 — User Lifetime: Engagement predicts lifetime. The correlation between promoter status and customer lifetime value is well-established. A customer who actively recommends the brand has already demonstrated a level of commitment that translates directly into longer retention and higher ARPU.
520 — Stories: Engaged customers become storytellers. The most valuable content the brand can produce is a promoter's authentic account of why they use and recommend it. Engagement measurement identifies who those promoters are. Stories strategy gives them a stage.
Conclusion
Satisfaction is easy to achieve and easy to mistake for something more. A customer who rates the last service 7/10 and never comes back is satisfied. A customer who rates it 6/10, calls to say why, and stays for three more years after the issue is resolved is engaged.
The dimension that distinguishes between those two customers — and builds systems to identify, track, and act on the difference — is Engagement. It is the Customer meta-category's mechanism for translating everything upstream (JTBD clarity, aspiration alignment, pain elimination) into a measurable relationship.
For archetypes where brand loyalty is the strategic imperative — A3, A4, A7 — a low Engagement score is the diagnostic that explains why the strategy is not working, even when the product is sound. Fix Engagement, and the downstream metrics follow. Leave it unmeasured, and the churn signal arrives in the revenue line: accurate, too late, and expensive to reverse.
Sources
Frederick Reichheld, "The One Number You Need to Grow", Harvard Business Review, December 2003 — hbr.org
Stellafai, "6 Leading Indicators to Accurately Predict Renewal and Churn", 2025 — stellafai.com
Marketing Canvas Method, Appendix E — Dimension 140: Engagement, Laurent Bouty, 2026
About this dimension
Dimension 140 — Engagement is part of the Customers meta-category (100) in the Marketing Canvas Method. The Customers meta-category contains four dimensions: Job To Be Done (110), Aspirations (120), Pains & Gains (130), and Engagement (140).
The Marketing Canvas Method is a complete marketing strategy framework built around 6 meta-categories, 24 dimensions, and 9 strategic archetypes. Learn more at marketingcanvas.net or in the book Marketing Strategy, Programmed by Laurent Bouty.
Marketing Canvas - Pains & Gains
A list of customer frustrations is research. A list of frustrations mapped to the journey stages where they occur is strategy. Dimension 130 of the Marketing Canvas explains the difference — and why getting it right determines the reliability of every downstream score.
About the Marketing Canvas Method
This article covers dimension 130 — Pains & Gains, part of the
Customers meta-category. The Marketing Canvas Method structures
marketing strategy across 24 dimensions and 9 strategic archetypes.
Full framework reference at
marketingcanvas.net →
·
Get the book →
In a nutshell
Pains & Gains (dimension 130) maps the obstacles and accelerators along the customer's job journey. Pains are the constraints, annoyances, and anxieties that slow progress. Gains are the moments of delight that exceed expectations — the unexpected experiences that make a customer stop and think: I didn't expect that.
The dimension is borrowed from Alexander Osterwalder's Value Proposition Canvas, but the Marketing Canvas sharpens it with one critical rule: pains and gains must be anchored to specific moments in the customer journey, not listed as abstract attributes. A list of frustrations is research. A list of frustrations mapped to the journey stages where they occur is strategy.
In the Marketing Canvas, Pains & Gains sits within the Customers meta-category alongside Job To Be Done (110), Aspirations (120), and Engagement (140). It is the research foundation that makes every downstream dimension scoreable with evidence rather than assumption.
The canonical distinction: list vs. map
Most companies do some version of pain and gain discovery. They run surveys, read reviews, conduct interviews, and compile a list of what customers find frustrating and what they appreciate. That list has value. But it has a critical limitation: it doesn't tell you when the pain occurs.
A pain that occurs before purchase — "I can't find reliable information about what's actually in the product" — requires a different initiative than a pain during purchase — "the checkout process is confusing" — or after purchase — "I don't know how to dispose of the packaging responsibly." All three are real. All three are different problems. Treating them as a single category of "customer frustrations" produces generic solutions that address none of them precisely.
The same applies to gains. A gain at the moment of first use — "the onboarding made me feel smart, not stupid" — serves a different strategic purpose than a gain during ongoing use — "I discovered a feature I hadn't expected that saved me an hour" — or at the advocacy stage — "the annual impact report made me feel proud enough to share it with my network."
The scoring test: can your team name specific pains at specific journey stages, backed by customer research rather than internal assumption? If yes, the dimension is working. If the team can only produce a generic list, the score cannot exceed +1 regardless of how long that list is.
The three journey stages
The Marketing Canvas structures pain and gain mapping across three stages:
Before purchase — the awareness, research, and consideration phase. Pains here are typically informational: difficulty finding credible information, inability to compare options clearly, uncertainty about whether the product fits the job. Gains here are trust signals: content that makes the customer feel informed rather than sold to, transparent pricing, social proof from people who share the customer's profile.
During — purchase, onboarding, and first use. Pains are typically friction: a complicated checkout, an overwhelming onboarding, a first experience that doesn't deliver the promised outcome quickly enough. Gains are confidence signals: a seamless transaction, an onboarding that makes the customer feel competent, a first result that delivers on the promise.
After — ongoing use, support interactions, renewal, and advocacy. Pains here are the most commercially costly: the confusion that leads to churn, the support interaction that erodes trust, the renewal moment that feels like a trap. Gains here are the highest-leverage: the unexpected delight that converts a satisfied customer into an active advocate.
Most companies over-invest in the "during" phase — the purchase moment — and under-invest in "before" and "after," which is precisely where acquisition and retention are won or lost.
Pains & Gains in the Marketing Canvas
The canonical question
What frustrates your customers and what delights them along their job journey?
The strategic role: foundational, not featured
Pains & Gains is the only dimension in the Customers meta-category that does not appear in any archetype's Vital 8. This is not an oversight — it is a deliberate design decision that reflects the dimension's true nature.
Think of it like gravity: it operates everywhere without being called out as a specific strategic priority. Pains & Gains is the research layer that feeds the scored dimensions above it. When you score Experience (420), the evidence comes from mapped pains. When you design Magic (440), the raw material comes from mapped gains. When you build Moments (410), you are working with the journey stages where pains and gains were discovered.
A company that has never mapped pains and gains rigorously will systematically overrate Experience, Magic, and Moments — because without specific evidence, teams default to optimistic assumptions. The Pains & Gains score is therefore a leading indicator of how reliable the rest of the audit is.
How to research pains and gains
Five methods, used in combination, produce a complete picture:
Customer interviews — the highest-signal source. One-on-one conversations focused on specific journey stages, asking customers to walk through their experience moment by moment. The interviewer's job is to resist explaining and keep probing: "tell me more about that moment," "what were you thinking when that happened," "what would have made that better."
Focus groups — useful for surfacing the language customers use to describe their experiences. The dynamic between participants often reveals shared frustrations that individuals might not articulate alone.
Customer journey mapping workshops — structured sessions where the team maps the journey from the customer's perspective, then validates each stage with customer evidence. The discipline: no stage can be populated with internal assumptions alone.
Social listening and review analysis — review platforms, social media conversations, and support ticket analysis provide unprompted feedback — the pains customers feel strongly enough to write down without being asked.
Feedback loops from existing touchpoints — systematic analysis of support interactions, NPS verbatims, and post-purchase surveys. The key is treating this data as journey-mapped evidence, not as an aggregate score.
Statements for self-assessment
Rate your agreement on a scale from −3 (completely disagree) to +3 (completely agree). There is no zero — the Marketing Canvas forces a directional position on every dimension.
Note on Detailed Track scoring: if averaging sub-question scores produces a mathematical zero, the method rounds to −1. A split score means the dimension is not clearly helping your goal — and "not clearly helping" requires the same investigation as "hurting."
Interpreting your scores
Negative scores (−1 to −3): Your understanding of customer pains and gains is absent, assumed, or not mapped to specific journey stages. The downstream effect is systematic: Experience (420), Moments (410), and Magic (440) scores will be based on internal assumptions rather than customer evidence, producing an audit that flatters rather than diagnoses.
Positive scores (+1 to +3): You have researched pains and gains using multiple methods, mapped them to specific journey stages, and can name specific initiatives that trace back to specific mapped pain or gain moments. The rest of your audit is grounded. Experience, Magic, and Moments scores have an evidence base.
Case study: Green Clean
Green Clean is a fictional eco-friendly residential cleaning service used as the recurring worked example throughout the Marketing Canvas Method.
Score: −2 to −1 (Weak) Green Clean has no formal pain and gain mapping. The team's understanding of customer frustrations comes from occasional informal conversations and their own assumptions about eco-conscious consumers. They believe the main pain is "finding eco-friendly products" — but this is a category-level assumption, not a journey-mapped insight. When asked to name the specific moment where customers most commonly abandon consideration of Green Clean, nobody can answer. When asked what the single biggest gain a new customer experiences at first service is, answers vary widely between team members. The research does not exist. Scores on Experience and Magic are almost certainly inflated.
Score: +1 to +2 (Developing) Green Clean has run a customer survey and conducted six customer interviews. They have identified a significant "before" pain: health-conscious parents spend considerable time researching whether eco-cleaning claims are credible, but Green Clean's website does not make it easy to verify ingredient safety independently. They have identified a strong "during" gain: the first service visit, when the cleaner explains the Family Health Report and what it will show, creates a moment of trust that customers consistently describe as "not what I expected from a cleaning company." The "after" stage is under-mapped — churn drivers are not yet understood. Research is partial but directional.
Score: +2 to +3 (Strong) Green Clean has mapped pains and gains across all three journey stages with customer-validated evidence. Before: the primary pain is "I can't tell which eco-claims are real without spending hours researching" — addressed by the published ingredient list and third-party certifications visible on the website before booking. During: the main pain is "I'm not sure what to expect from the first visit" — addressed by a structured onboarding sequence that sets expectations and delivers the first Family Health Report within 24 hours. After: the primary gain driver is the monthly impact statement showing cumulative toxin load avoided — customers who receive it are 3× more likely to refer Green Clean to a neighbour. Every initiative in Experience (420) and Magic (440) traces back to a specific mapped pain or gain at a specific journey stage.
Connected dimensions
Pains & Gains is the research input for multiple downstream dimensions:
110 — JTBD: Pains block the job; gains accelerate it. The pain map is the obstacle layer sitting between the customer and the job they are trying to accomplish. Understanding pains at journey stages often reveals which aspect of the job is most underserved.
410 — Moments: Pains and gains map to specific journey moments. Dimension 130 is the discovery phase; dimension 410 is the design phase built on that discovery. You cannot score Moments honestly without having completed the Pains & Gains mapping first.
420 — Experience: Experience design eliminates pains. The initiatives that raise an Experience score should trace directly to specific mapped pains at specific journey stages. If they don't, the Experience score is assumption-based.
440 — Magic: Magic creates unexpected gains. The raw material for Magic — the specific moments of delight that exceed expectations — comes from gain mapping. Without it, Magic initiatives are based on what the team finds delightful, not what customers actually experience as exceeding their expectations.
Conclusion
Pains & Gains has a paradoxical position in the Marketing Canvas: it is the most foundational dimension in the Customers meta-category, and the one least likely to appear in headlines about strategy.
That is precisely why it matters. The teams that skip rigorous pain and gain mapping — or treat it as a list-generation exercise rather than a journey-mapping discipline — produce audits built on assumption. They score Experience at +2 because they believe the experience is good, not because they have mapped the journey stage by stage and found evidence that it is.
The scoring test is the same as it has always been: not "do we know what customers find frustrating?" but "can we name specific pains at specific journey stages, backed by research?" The first question has a comfortable answer. The second one is the one that matters.
Sources
Alexander Osterwalder, Yves Pigneur, Greg Bernarda, Alan Smith, Value Proposition Design, Wiley, 2014 — strategyzer.com
Tony Ulwick, Jobs to be Done: Theory to Practice, Strategyn Press, 2016 — strategyn.com
Marketing Canvas Method, Appendix E — Dimension 130: Pains & Gains, Laurent Bouty, 2026
About this dimension
Dimension 130 — Pains & Gains is part of the Customers meta-category (100) in the Marketing Canvas Method. The Customers meta-category contains four dimensions: Job To Be Done (110), Aspirations (120), Pains & Gains (130), and Engagement (140).
The Marketing Canvas Method is a complete marketing strategy framework built around 6 meta-categories, 24 dimensions, and 9 strategic archetypes. Learn more at marketingcanvas.net or in the book Marketing Strategy, Programmed by Laurent Bouty.
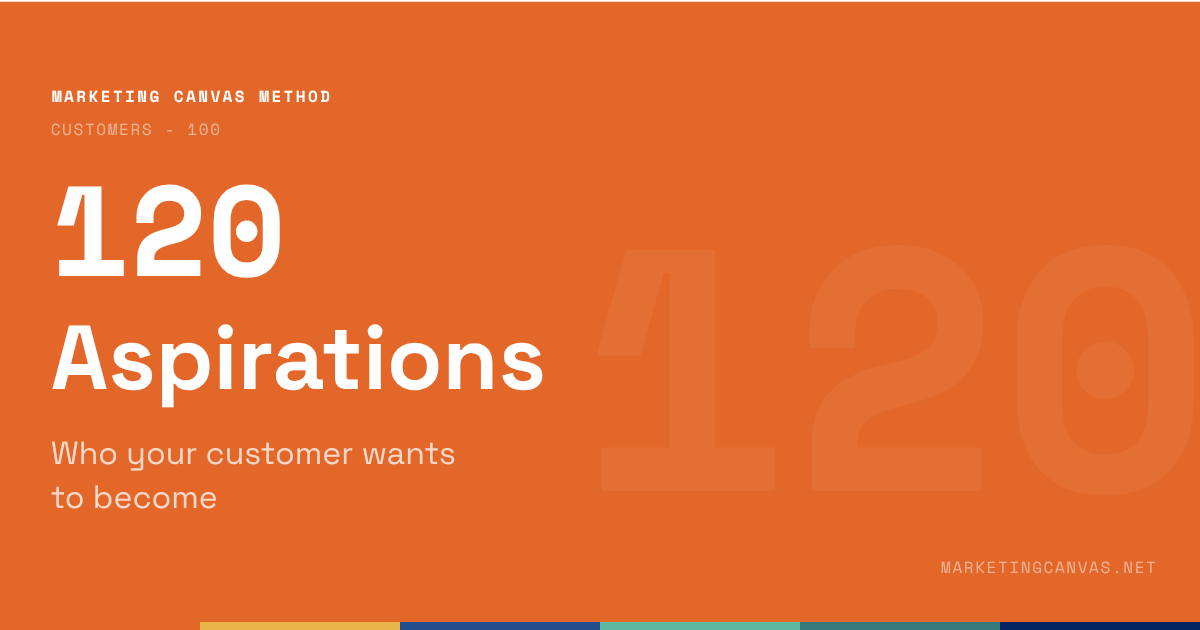
Marketing Canvas - Aspirations
Features convert browsers into buyers. Aspirations convert buyers into advocates. Dimension 120 of the Marketing Canvas scores the identity layer — who your customers are trying to become — and explains why brands that connect to it earn loyalty that feature parity cannot replicate.
About the Marketing Canvas Method
This article covers dimension 120 — Aspirations, part of the
Customers meta-category. The Marketing Canvas Method structures
marketing strategy across 24 dimensions and 9 strategic archetypes.
Full framework reference at
marketingcanvas.net →
·
Get the book →
In a nutshell
Aspirations (dimension 120) captures who your customer wants to become. Not what they want to accomplish — that is Job To Be Done (110). Who they want to be as a result of accomplishing it.
This is the identity layer of the Customers meta-category. It maps the gap between the customer's current self and their desired self — across three levels: personal improvement, social contribution, and environmental responsibility. The brands that connect to this layer earn loyalty that feature parity cannot touch, because they are no longer selling a product. They are helping a customer become a better version of themselves.
In the Marketing Canvas, Aspirations sits within the Customers meta-category alongside Job To Be Done (110), Pains & Gains (130), and Engagement (140). It is the dimension that elevates strategy from solving a problem to participating in a customer's story.In the Marketing Canvas
Aspirations vs. Job To Be Done: the critical distinction
These two dimensions are adjacent and easily confused. The distinction is not about time horizon — it is about the level of analysis.
JTBD answers: what is the customer trying to accomplish? Aspirations answers: who is the customer trying to become?
A fitness app solves the functional job of tracking workouts. The emotional job is feeling accomplished after each session. But the aspiration is something longer and deeper: become someone who takes care of their body. That aspiration outlasts any single workout, any single app update, any feature comparison. The brand that connects to it owns a relationship that a competitor with better features cannot simply steal.
This distinction matters for scoring. A company can score +2 on JTBD — they understand the functional and emotional jobs precisely — and still score −1 on Aspirations if they have never researched who their customers are trying to become. The two dimensions are complementary, not redundant.
The three levels of aspiration
Aspirations in the Marketing Canvas operate across three scored levels, each requiring its own research:
Personal improvement — who the customer wants to become as an individual. "I want to be healthier." "I want to be more financially independent." "I want to be someone who makes responsible choices." This is the self-improvement layer. Brands that connect to it become partners in the customer's personal development, not just vendors of solutions.
Social contribution — how the customer wants to be seen and what they want to give back. "I want to be known as someone who sets a good example." "I want to contribute positively to my community." "I want my household to be a model for neighbours." This is the social identity layer. It drives word-of-mouth, public brand advocacy, and the social signalling that makes premium pricing justified.
Environmental responsibility — how the customer wants to reduce their negative impact on the world. "I want to leave less waste." "I want to live consistently with my values about the planet." "I want my family's consumption to be something I'm not ashamed of." This is increasingly a primary aspiration layer, not a peripheral one — research shows 72% of global consumers are willing to pay more for sustainable products, with 55% citing environmental responsibility as extremely important in their brand choices.
Score negative when aspirations are assumed rather than researched, or when the value proposition addresses only functional needs without connecting to identity. Score positive when marketing, product design, and service delivery all reference who the customer is becoming, not just what they are buying.
Aspirations in the Marketing Canvas
The canonical question
Who does your customer want to become?
Aspirations appears in the Vital 8 of two archetypes — in roles that reflect the identity-driven nature of the dimension:
Primary Accelerator for A8 (Niche Expert): Deep aspiration understanding is precisely what separates a niche authority from a narrow generalist. A niche expert's audience has specific, well-developed aspirations — they want to become a serious practitioner, a recognised authority, a member of an expert community. The brand that understands those aspirations at depth can serve them in ways a generalist never could: curating the exact knowledge, the exact proof standards, the exact community signals that matter to this audience. Shallow aspiration understanding produces generic "premium" positioning. Deep aspiration understanding produces authority that commands both pricing power and advocacy.
Secondary Brake for A5 (Pivot Pioneer): A company executing a strategic pivot is translating itself from one identity to another. The risk is misreading what its customers aspire to in the new direction. Customers who followed the brand through the old aspiration may not share the new one. New customers may have aspirations the brand doesn't yet understand. A Pivot Pioneer that moves without mapping the aspiration landscape of both groups risks building a new strategy on assumed demand. The aspiration score acts as a reality check: has the team actually researched who the new customer wants to become, or are they projecting?
Why aspirations create loyalty features cannot
Customers can evaluate features rationally. They can compare specifications, read reviews, and switch to a better-performing alternative. Features create preference. They rarely create commitment.
Aspirations create commitment because they operate at the identity level. When a brand helps a customer become who they want to be, leaving the brand feels like abandoning progress on that identity. The customer does not just lose a product — they lose a partner in their story.
Research on brand identity and consumer behaviour consistently confirms this mechanism: brand-lifestyle congruence — the degree to which a brand aligns with who the customer is trying to become — significantly affects repurchase intention and brand advocacy, independent of product satisfaction scores. Consumers who feel a brand reflects their aspirational identity stay loyal even when cheaper or functionally equivalent alternatives exist.
This is why aspiration-connected customers behave differently: they refer more, defend the brand when challenged, and tolerate imperfection more readily. They are not just loyal to the product. They are invested in the brand as part of their own story.
Brand examples: aspirations at work
Patagonia — customers are not buying outdoor clothing. They aspire to be people who live according to environmental values, who make choices consistent with their beliefs about the planet. Patagonia earns that aspiration connection not through product claims but through actions: donating 1% of sales to environmental causes, suing the US government over national monument reductions, giving the company to a climate trust. Each action reinforces the customer's aspiration. The product is almost incidental.
Tesla — the aspiration is not "drive an electric car." It is "be part of the transition to a sustainable future" and "be seen as someone who acts on their values, not just talks about them." Early Tesla buyers were not just making a transport decision. They were making an identity statement. That aspiration premium is why Tesla commanded a waiting list when competitors offered comparable EVs at lower prices.
Dove — the "Real Beauty" campaign worked because it connected to a widespread aspiration: "be a person who defines beauty on their own terms, not on society's." Customers were not just buying moisturiser. They were participating in a statement about who they wanted to be and what kind of world they wanted to build.
In each case, the aspiration outlasted any single product version, price change, or competitive threat.
Statements for self-assessment
Rate your agreement on a scale from −3 (completely disagree) to +3 (completely agree). There is no zero — the Marketing Canvas forces a directional position on every dimension.
Note on Detailed Track scoring: if averaging sub-question scores produces a mathematical zero, the method rounds to −1. A split score means the dimension is not clearly helping your goal — and "not clearly helping" requires the same investigation as "hurting."
Interpreting your scores
Negative scores (−1 to −3): Your understanding of customer aspirations is absent, assumed, or limited to the functional layer. The likely result: marketing and products address what customers want to do, not who they want to become. Identity-connected loyalty remains inaccessible. The most vocal and valuable customer segment — those who aspire actively and advocate publicly — does not recognise themselves in your brand.
Positive scores (+1 to +3): You understand what your customers are trying to become, at all three levels, and that understanding comes from research. Your marketing, product design, and service delivery all reference the customer's identity journey — not just the task they hired you to complete. Aspiration-connected customers are engaging, advocating, and remaining loyal beyond what feature comparisons alone would predict.
Case study: Green Clean
Green Clean is a fictional eco-friendly residential cleaning service used as the recurring worked example throughout the Marketing Canvas Method.
Score: −2 to −1 (Weak) Green Clean's marketing speaks entirely to the functional job: "clean your home safely." The team has never formally researched who their customers aspire to become. When asked, they assume: "our customers want eco-friendly products." That is a product preference, not an aspiration. No marketing materials reference the customer's identity. There is no language about what kind of household, parent, or community member Green Clean helps customers become. Customers who share deep personal, social, or environmental aspirations do not recognise themselves in any Green Clean communication. The brand is invisible to the aspiration layer where the most loyal and vocal customers live.
Score: +1 to +2 (Developing) Green Clean has begun to connect to the personal aspiration layer. Customer research has surfaced a clear personal aspiration: "be a parent who genuinely protects their family, not just one who tries." Some marketing has shifted toward this — the Family Health Report was designed partly to give customers evidence of who they are becoming ("a household that actively reduces toxin exposure"). But the social aspiration layer is underexplored: Green Clean does not yet help customers express their choices to others or become visible models in their community. The environmental aspiration layer is present in brand values but not yet in customer-facing language. Aspiration understanding is partial, and only one of the three levels is actively served.
Score: +2 to +3 (Strong) Green Clean's value proposition connects to all three aspiration levels with precision drawn from research, not assumption. Personal: "be the parent who actually protects their family's health, not just the one who means to." Social: "be the household your neighbours ask about — the one that proved you can live without compromise." Environmental: "be part of the generation that changed what 'clean' means, for homes and for the planet." Each initiative traces back to a specific aspiration level. The Family Health Report serves personal aspiration. The referral programme ("invite a neighbour") serves social aspiration. The annual impact statement serves environmental aspiration. Customer acquisition through word-of-mouth grew to 35% of new customers by 2024 — the direct commercial evidence that aspiration-connected customers advocate actively.
Connected dimensions
Aspirations does not operate in isolation. Five dimensions connect most directly:
110 — JTBD: The job feeds the aspiration. The customer who hires Green Clean to "protect indoor health" (the job) aspires to "be a parent who doesn't compromise on what their family breathes" (the aspiration). Understanding the job is the prerequisite for understanding the aspiration that drives it.
140 — Engagement: Aspiration-connected customers engage more deeply. The link between aspiration understanding and engagement is direct — when a brand participates in a customer's identity story, every touchpoint becomes meaningful rather than transactional.
210 — Purpose: Brand purpose should mirror customer aspiration. If customers aspire to be people who make environmentally responsible choices, a brand whose purpose is "eliminate indoor toxins" is speaking the same language. A brand whose purpose is "deliver cleaning excellence" is not.
230 — Values: Values operationalise aspiration alignment. The values a brand lives out daily are the signals that tell aspiration-driven customers whether this brand is genuinely part of their story or just claiming to be.
320 — Emotions: Emotional benefits serve the aspiration. The emotional payoff a customer feels during and after using a product is the moment-to-moment evidence that the aspiration is being fulfilled. Design the emotional experience backward from the aspiration.
Conclusion
Aspiration is the dimension that converts customers into advocates. Features convert browsers into buyers. Aspirations convert buyers into members of something.
The scoring question is not "do we know what our customers want?" Most companies do. It is whether the team can articulate who their customers are trying to become — at the personal, social, and environmental levels — based on research rather than assumption. When that answer is yes, the marketing almost writes itself: it speaks directly to the customer's story, not the product's features.
The brands that dominate in mature markets — where features converge and price wars erode margins — almost always have one structural advantage: they understand the aspiration layer. Patagonia, Tesla, and Dove did not win on product. They won on identity.
Sources
Clayton Christensen, Taddy Hall, Karen Dillon, David S. Duncan, Competing Against Luck, Harper Business, 2016
Pham et al., "The role of brand identity, brand lifestyle congruence, and brand satisfaction on repurchase intention", Humanities and Social Sciences Communications, Nature, 2024 — nature.com
DAC Group, "Beyond Points: How Brand Loyalty Is Being Redefined in 2025", DAC, 2025 — dacgroup.com
Marketing Canvas Method, Appendix E — Dimension 120: Aspirations, Laurent Bouty, 2026
About this dimension
Dimension 120 — Aspirations is part of the Customers meta-category (100) in the Marketing Canvas Method. The Customers meta-category contains four dimensions: Job To Be Done (110), Aspirations (120), Pains & Gains (130), and Engagement (140).
The Marketing Canvas Method is a complete marketing strategy framework built around 6 meta-categories, 24 dimensions, and 9 strategic archetypes. Learn more at marketingcanvas.net or in the book Marketing Strategy, Programmed by Laurent Bouty.
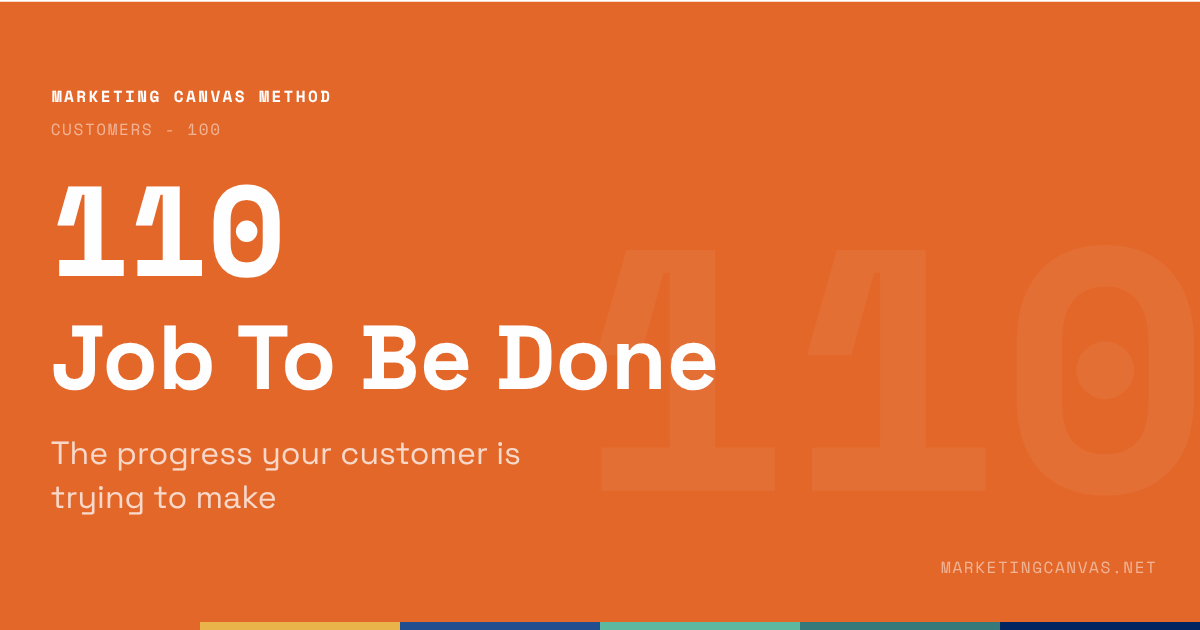
Marketing Canvas - Job To Be Done
Customers don't buy products — they hire them to make progress. Dimension 110 of the Marketing Canvas explains how to define the job at all three layers (functional, emotional personal, emotional social), why it is a Fatal Brake for Category Creators, and the single diagnostic sentence that exposes whether your team actually knows it.
About the Marketing Canvas Method
This article covers dimension 110 — Job To Be Done, part of the
Customers meta-category. The Marketing Canvas Method structures
marketing strategy across 24 dimensions and 9 strategic archetypes.
Full framework reference at
marketingcanvas.net →
·
Get the book →
In a nutshell
Job To Be Done (dimension 110) captures the ultimate objective that inspires a customer to hire your product or service. Not a description of what your product does. The reason a customer reaches for it in the first place — the progress they are trying to make in their life.
Theodore Levitt put it plainly in 1960: people don't want a quarter-inch drill. They want a quarter-inch hole. But the Marketing Canvas goes further. The hole is still only the surface. The functional job ("hang a picture") sits beneath an emotional job ("feel proud of my home") and a social job ("be seen as someone with good taste"). All three determine which product wins. Scoring only the functional layer produces a dimension score that flatters and misleads.
In the Marketing Canvas, JTBD is the first dimension in the Customers meta-category — the starting point for everything. Before positioning, before features, before pricing: who are your customers and what are they trying to accomplish?
What JTBD actually is
Customers don't buy products. They hire them to make progress.
That reframing has a sharp implication: the real competition for any product is not other products in the same category. It is every solution the customer could hire for the same job. Spotify competes with podcasts, meditation apps, and audiobooks — because all of them compete for the same job: "help me feel less anxious during my commute." Netflix competes with sleep. Understanding the job reveals the competition that a feature-based analysis never finds.
Jobs change slowly. Solutions change constantly.
This is the strategic insight that makes JTBD durable. A customer's functional job ("get from A to B without owning a car") has existed for decades. The solutions that serve it — taxis, rental cars, Uber, Lime scooters — change with technology. Brands that define themselves by the solution become obsolete when the solution changes. Brands that define themselves by the job remain relevant regardless.
Clayton Christensen, who popularised the framework in Competing Against Luck (2016), put it this way: jobs aren't just about function — they have powerful social and emotional dimensions. A brand that only understands the functional layer of its customer's job is working with a partial map.
Clayton Christensen, professor at Harvard Business School talks about the job to be done.
The three layers of every job
The Marketing Canvas structures JTBD across three scored sub-questions — one per layer. All three must be understood to score the dimension honestly:
Functional job — the tangible, measurable task the customer needs to accomplish. "Get my home clean." "File my tax return." "Track my fitness." This is the layer most companies understand reasonably well. It is necessary but not sufficient.
Emotional personal job — how the customer wants to feel as a result of getting the job done. "Feel safe in my own home." "Feel in control of my finances." "Feel like someone who takes care of themselves." This layer is what differentiates brands in mature categories where functional performance has converged. Two cleaning services that perform identically will be separated by which one makes the customer feel more like the person they want to be.
Emotional social job — how the customer wants to be perceived by others as a result of the purchase. "Be seen as a responsible parent." "Be known as someone who makes smart financial decisions." "Be recognised as someone who takes health seriously." This layer drives premium pricing, word-of-mouth, and tribal loyalty. It is the layer most commonly undiscovered because customers rarely articulate it directly — it has to be observed or inferred.
Job To Be Done
JTBD in the Marketing Canvas
The canonical question
What job is the customer hiring your product to do?
JTBD appears in the Vital 8 of three archetypes — in the highest-stakes roles:
Fatal Brake for A9 (Category Creator): You cannot create a category around a job you haven't named. This is the existential challenge for any company attempting category creation — the job must be defined, named, and taught to the market before any scaling investment makes sense. Green Clean's entire strategic progression hinged on shifting from "eco-cleaning company" (a crowded, undifferentiated category) to "the company that protects your family from indoor toxins" (a job the market hadn't yet named). The 2021 JTBD score of −1 blocked all ALIGN activity until the job was defined. That gate is not a bureaucratic rule — it reflects the reality that you cannot market a job the customer doesn't yet recognise.
Secondary Brake for A4 (Stagnant Leader): Losing touch with the job is the first sign of strategic drift. Leaders stagnate when their product roadmap continues to answer the job their customers used to have rather than the one they have now. Kodak understood the job of "preserve memories" — but only in the film layer. When the job migrated to digital, Kodak's JTBD score quietly turned negative while revenue held. The revenue metric lagged the strategic failure by years.
Secondary Brake for A8 (Niche Expert): A niche expert's authority rests on understanding the customer's job at a depth generalists cannot match. When a niche expert begins to drift toward average-customer thinking — serving the mainstream version of the job rather than the specific, nuanced version their segment actually has — the authority erodes. The niche is lost before the revenue line shows it.
Marketing Canvas by Laurent Bouty - Job To Be Done
The red flag test
The Marketing Canvas applies a single diagnostic sentence to determine whether a JTBD score can reach +2 or above:
Can your team complete the sentence "Customers hire us to help them ___" without mentioning a feature?
If the answer requires a feature — "customers hire us to help them use our proprietary cleaning formula" — the job is not yet defined. The feature is the solution. The job is independent of any particular solution. A score of 0 or below is the honest result until the sentence can be completed in customer language: "customers hire us to help them know their family is safe at home."
This test consistently exposes the gap between a company that sells a product and a company that understands its job. The sentence has to be written in customer language, not marketing copy. "Enable sustainable home care solutions" fails the test. "Help me know my children aren't breathing toxins" passes it.
Statements for self-assessment
Rate your agreement on a scale from −3 (completely disagree) to +3 (completely agree). There is no zero — the Marketing Canvas forces a directional position on every dimension.
Note on Detailed Track scoring: if averaging sub-question scores produces a mathematical zero, the method rounds to −1. A split score means the dimension is not clearly helping your goal — and "not clearly helping" requires the same investigation as "hurting."
Interpreting your scores
Negative scores (−1 to −3): Your understanding of the customer's job is incomplete, product-defined, or unvalidated by research. The likely result: marketing talks about solutions customers don't recognise as theirs; innovation addresses the wrong problem; competitors who understand the job more deeply will win the customer without a price war.
Positive scores (+1 to +3): You understand what customers are hiring you to do — at all three layers — and that understanding is grounded in research, not assumption. Marketing speaks the customer's language. Product decisions trace back to the job. You can name competitors from completely different categories that serve the same job.
Case study: Green Clean
Green Clean is a fictional eco-friendly residential cleaning service used as the recurring worked example throughout the Marketing Canvas Method.
Score: −2 to −1 (Weak) Green Clean understands the functional job superficially: "get the house clean using eco-friendly products." They have not identified the emotional personal job ("feel confident that my home is genuinely safe, not just superficially tidy") or the emotional social job ("be the kind of parent who makes responsible choices for my family"). Their marketing talks about product ingredients and eco-certifications — solution language, not job language. The team cannot complete the red flag sentence without mentioning a product feature. Customers who share the deeper job don't recognise themselves in Green Clean's messaging. The brand reaches people who already care about eco-cleaning; it doesn't reach the larger group who care about family health and haven't yet connected that job to a cleaning service.
Score: +1 to +2 (Developing) Green Clean has begun to articulate the deeper job: "protect indoor health." The functional layer is clear. The emotional personal layer is partially mapped — customer research has identified that parents are the primary segment and that the dominant emotional driver is "not worrying about what my children are exposed to." The emotional social layer is still assumed rather than researched. Marketing has started shifting from ingredient-led to outcome-led language, but execution is uneven. Some campaigns lead with health; others still lead with eco-credentials. The team can complete the red flag sentence most of the time, though the phrasing varies between team members — a sign the job definition hasn't fully landed internally.
Score: +2 to +3 (Strong) Green Clean's JTBD is precisely defined across all three layers and validated by customer research. Functional: "keep my home free from toxic chemical residues." Emotional personal: "feel confident that the air my children breathe at home is safe." Emotional social: "be a household my neighbours know takes health and environment seriously." The Family Health Report — a monthly transparency dashboard showing toxin load avoided per visit — was designed directly from the emotional personal layer. It addresses the job, not the service feature. Every team member completes the red flag sentence in the same language. Marketing leads with the job. The job definition has been stable for 18 months, even as the product has evolved.
Connected dimensions
JTBD does not operate in isolation. Five dimensions connect most directly:
120 — Aspirations: The job feeds the aspiration. If the job is "protect my family's health," the aspiration is "be a parent who makes responsible choices." The aspiration is the identity version of the job — who the customer wants to become as a result of getting it done.
130 — Pains & Gains: Pains block the job. Gains accelerate it. A precise JTBD definition is the prerequisite for mapping pains and gains usefully — without it, you're cataloguing frictions without knowing which ones matter.
220 — Positioning: Positioning is how you frame the job externally. Green Clean's positioning shift from "eco-friendly cleaning" to "indoor health protection" is a direct translation of the JTBD from internal strategy to external claim. Positioning that doesn't reference the job occupies no mental real estate.
310 — Features: Features must solve the job. Every feature that doesn't serve the customer's job is complexity without value. The JTBD definition is the filter that decides which features matter and which are engineering ambition.
320 — Emotions: The emotional job defines the target feeling. Emotional benefits in the value proposition are the delivery mechanism for the emotional layer of the job. If you don't know the emotional job, you cannot design the right emotional benefit.
Conclusion
Job To Be Done is the first dimension in the Marketing Canvas for a reason. Everything downstream — positioning, features, pricing, experience, stories — only makes sense if it is oriented toward a job the customer actually has.
The strategic error is not failing to understand JTBD in theory. Most marketers can explain the drill-and-hole metaphor. The error is defining the job in product terms rather than customer terms, validating it with internal assumptions rather than customer research, and stopping at the functional layer without mapping the emotional dimensions that determine which brand wins when products perform comparably.
The test is simple: can your team complete the sentence without mentioning a feature? If they can — in consistent, customer-language — the dimension is working. If they can't, everything built on top of it is built on a assumption.
Sources
Theodore Levitt, "Marketing Myopia", Harvard Business Review, 1960 — hbr.org
Clayton Christensen, Taddy Hall, Karen Dillon, David S. Duncan, Competing Against Luck, Harper Business, 2016
Alan Klement, When Coffee and Kale Compete, 2018 — alanklement.com
Tony Ulwick, Jobs to be Done: Theory to Practice, Strategyn Press, 2016 — strategyn.com
Marketing Canvas Method, Appendix E — Dimension 110: Job To Be Done, Laurent Bouty, 2026
About this dimension
Dimension 110 — Job To Be Done is part of the Customers meta-category (100) in the Marketing Canvas Method. The Customers meta-category contains four dimensions: Job To Be Done (110), Aspirations (120), Pains & Gains (130), and Engagement (140).
The Marketing Canvas Method is a complete marketing strategy framework built around 6 meta-categories, 24 dimensions, and 9 strategic archetypes. Learn more at marketingcanvas.net or in the book Marketing Strategy, Programmed by Laurent Bouty.