Marketing Canvas - Engagement
In a Nutshell — 140 Engagement
Engagement (Dimension 140) measures the quality and depth of the relationship between brand and customer — not satisfaction, which a customer can feel while being completely disengaged. Engagement is active participation: recommending the brand, providing feedback, returning without being prompted, defending the brand when criticized. The method uses NPS as a starting point but goes further, examining the promoter/detractor ratio and whether the company has systems in place to act on what both groups say. The diagnostic signal: churn doesn't happen suddenly — it's preceded by declining engagement signals: fewer logins, slower responses to outreach, silence where there was feedback. Companies that monitor engagement catch churn before it appears in revenue. Engagement is a Fatal Brake for A3 (Brand Evangelist) — if the tribe isn't engaged, there is no tribe — and a Primary Accelerator for both A4 (Stagnant Leader) and A7 (Scale-Up Guardian), where deepening engagement is the primary defense against churn.
Engagement as a leading indicator of churn
The most commercially important insight in this dimension is also the least intuitive: engagement is a leading indicator of churn, while revenue is a lagging one.
Churn does not happen suddenly. It is preceded by a sequence of declining engagement signals — fewer referrals, slower response to outreach, silence where there used to be feedback, reduced product usage depth, a shift from promoter to passive. By the time churn appears in the revenue line, the customer made the decision weeks or months earlier. Companies that track engagement signals catch that decision in progress. Companies that track only revenue discover it after the fact.
Research consistently confirms this pattern. A 2025 analysis of customer engagement as a retention predictor found that engagement metrics — frequency of use, depth of feature adoption, responsiveness to outreach — signal churn risk before any revenue indicator does. Customers who begin ignoring key features are significantly more likely to churn; those who maintain consistent usage patterns, even at modest levels, renew at materially higher rates.
The practical implication for the Marketing Canvas: a company that scores Engagement at −1 is not just describing a weak customer relationship today. It is describing a churn problem that will show up in User Lifetime (630) figures within the next 6–12 months.
What engagement actually measures
Engagement is active participation. The four observable forms:
Recommendation — does the customer refer the brand to others without being asked? Unprompted referral is the strongest engagement signal because it requires the customer to put their own reputation behind the brand. Green Clean's 35% referral rate by 2024 was the clearest evidence of high engagement — customers were actively recruiting new ones.
Feedback — does the customer respond to outreach, complete surveys, attend review sessions, and provide input into product or service evolution? A customer who stops providing feedback is not neutral — they have disengaged. Silence is a signal.
Return without prompt — does the customer come back without a campaign, a discount, or a re-engagement effort? Repeat purchase driven by marketing spend is retention. Repeat purchase driven by habit and relationship is engagement.
Defence under challenge — does the customer defend the brand when it is criticised? This is the tribal signal. Customers who have moved from satisfied to engaged will tell a sceptical colleague "actually, here's why I use them" without being asked to.
The NPS instrument
The classic measurement tool for Engagement is the Net Promoter Score — a single question that segments customers into three groups based on their likelihood to recommend:
Promoters (score 9–10): actively recommend the brand to others. The growth engine. Every promoter generates acquisition at zero additional cost. The strategic goal is to grow this group and give them the tools to advocate effectively.
Passives (score 7–8): satisfied but not engaged. They stay until something better comes along or a pain accumulates. They do not recommend, but they do not damage the brand either. The strategic goal is to understand what would move them to promoter status.
Detractors (score 0–6): dissatisfied and potentially vocal. They represent churn risk and reputational risk simultaneously. The strategic goal is not to ignore them — detractor verbatims are the richest source of improvement intelligence in any customer base.
The NPS score itself (% Promoters − % Detractors) is useful as a tracking metric. What matters more in the MCM audit is the ratio between the two groups and whether the company has systems in place to act on what both groups are saying. A high NPS with no feedback loop is a number, not a strategy.
Score negative if engagement is unmeasured, or measured only through satisfaction surveys. Score positive when the company tracks promoter/detractor ratios, acts on the feedback, and can demonstrate a link between engagement scores and business outcomes.

Engagement in the Marketing Canvas
The canonical question
How deeply connected are your customers to your brand?
Engagement appears in the Vital 8 of three archetypes — and the roles span the full range of urgency:
Fatal Brake for A3 (Brand Evangelist): The Brand Evangelist archetype is built entirely on tribal belonging. If the tribe is not engaged, there is no tribe — just customers who happen to have bought the same product. Patagonia's NPS of 70+ and customer retention of 82% by 2022 are not incidental. They are the strategic output of an engagement system built around Worn Wear, environmental activism, and community events that make customers active participants rather than passive purchasers. For A3, a low Engagement score does not mean "improve the relationship." It means the entire archetype is failing.
Primary Accelerator for A4 (Stagnant Leader): A leader experiencing stagnation faces a leaky bucket — churn is rising while acquisition is fighting to refill it. Deepening engagement with the existing customer base is the primary defence. It is cheaper to re-engage a passive customer than to acquire a new one. It is far cheaper to convert a detractor's concern into product improvement than to lose them and acquire a replacement. For A4, Engagement is not a nice-to-have — it is the mechanism that slows the leak while the experience is being fixed.
Primary Accelerator for A7 (Scale-Up Guardian): Hypergrowth tends to destroy the relationships that created growth. As teams scale, as processes become standardised, as the personal touch disappears, early adopters shift from promoters to passives. The Scale-Up Guardian's specific challenge is maintaining engagement quality while growing volume. Tracking engagement signals during rapid growth is the early warning system that tells leadership whether the brand is scaling its relationship — or just scaling its revenue.
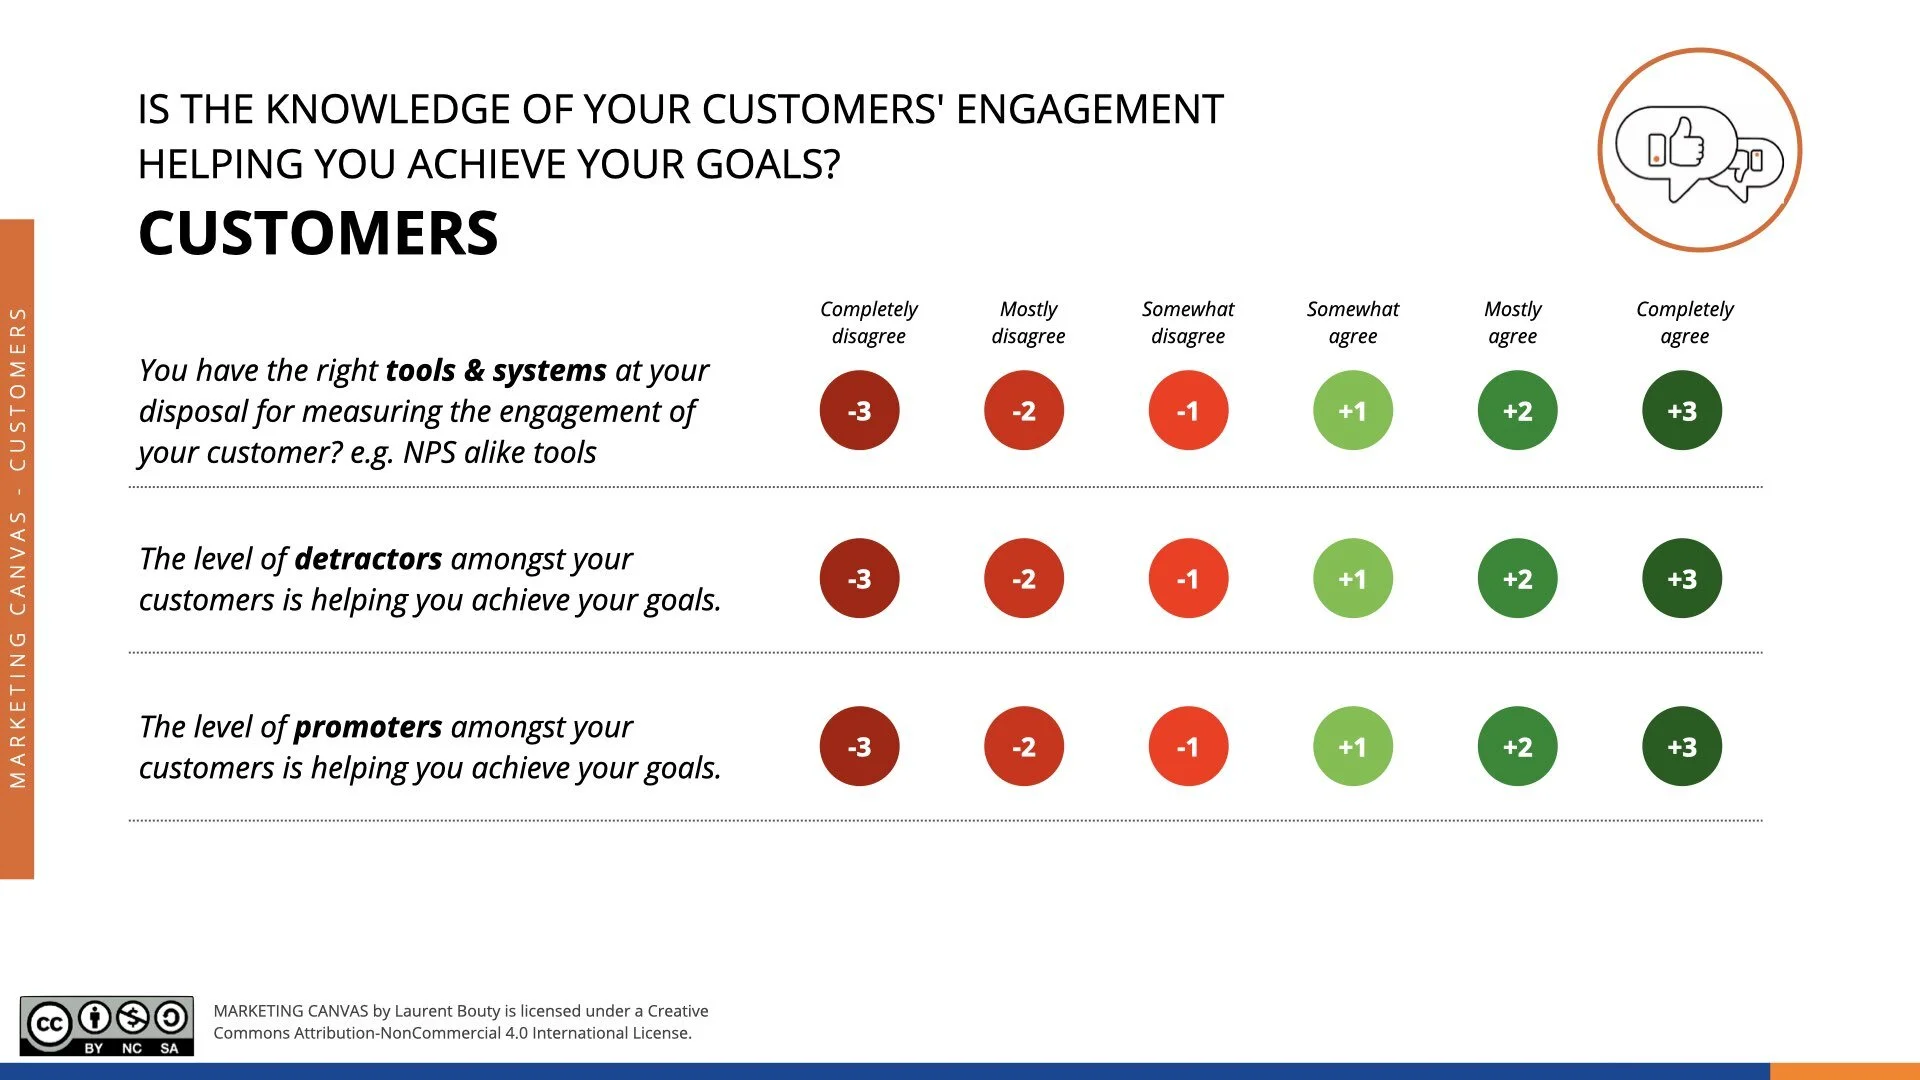
Statements for self-assessment
Rate your agreement on a scale from −3 (completely disagree) to +3 (completely agree). There is no zero — the Marketing Canvas forces a directional position on every dimension.
Note on Detailed Track scoring: if averaging sub-question scores produces a mathematical zero, the method rounds to −1. A split score means the dimension is not clearly helping your goal — and "not clearly helping" requires the same investigation as "hurting."
Interpreting your scores
Negative scores (−1 to −3): Engagement is unmeasured, or measured only through satisfaction surveys that don't distinguish between satisfied-and-disengaged and genuinely loyal. Detractors are not being systematically identified or addressed. Promoters are not being activated. Churn signals are invisible until they appear in the revenue line — by which point the decision has already been made.
Positive scores (+1 to +3): Engagement is tracked systematically through promoter/detractor ratios and behavioural signals. Detractor feedback feeds directly into service and product improvements. Promoters have tools and reasons to advocate. The company can demonstrate a measurable link between engagement scores and retention outcomes. Engagement is functioning as the leading indicator it is designed to be.Case study: Green Clean’s Engagement strategy
Misaligned understanding (-3, -2, -1): Green Clean lacks the tools to measure engagement and struggles to address customer dissatisfaction. Detractors outnumber promoters, harming the brand’s reputation, while sustainability efforts are absent from its engagement strategy.
Surface understanding (0): Green Clean uses basic tools like surveys but lacks a cohesive approach to managing detractors and empowering promoters. Sustainability is a peripheral concern, limiting its appeal to eco-conscious customers.
Deep understanding (+1, +2, +3): Green Clean leverages NPS and behavioral data to track engagement effectively. It proactively resolves detractor concerns, encourages promoters to share positive reviews, and integrates sustainability into its messaging, fostering strong customer relationships.
Case study: Green Clean
Green Clean is a fictional eco-friendly residential cleaning service used as the recurring worked example throughout the Marketing Canvas Method.
Score: −2 to −1 (Weak) Green Clean has no formal engagement measurement. The team sends an annual satisfaction survey — three questions, 22% response rate — and reads the results as confirmation that customers are happy. There is no NPS measurement. No promoter/detractor tracking. No system for capturing or acting on feedback between services. When a customer cancels, the cancellation is processed without any outreach to understand why. The churn rate of 20% in 2021 is treated as an industry benchmark issue, not an engagement signal. The team cannot name a single specific action taken in response to customer feedback in the past twelve months. Engagement is not measured. Engagement is not managed.
Score: +1 to +2 (Developing) By 2022, Green Clean has introduced NPS measurement after each service visit. They have identified a promoter group (score 9–10) representing 38% of customers, and a detractor group (score 0–6) representing 14%. The promoter group is being asked for referrals informally. The detractor group is contacted by the founder within 48 hours of a low score — a process that is recovering approximately 40% of those customers. A quarterly feedback session with a sample of long-term customers is feeding service improvements. But the system is still primarily reactive: engagement is being tracked, but not yet used as a leading churn indicator. The referral rate sits at 18% — growing, but not yet the dominant acquisition channel.
Score: +2 to +3 (Strong) Green Clean's engagement system is proactive and closed-loop. NPS is tracked after every service visit and monthly at the account level. Detractor verbatims are reviewed weekly and feed directly into the service improvement backlog — four product changes in 2023 traced directly to detractor feedback. Promoters receive structured advocacy tools: referral cards, a community group, and the option to share their Family Health Report data publicly with anonymisation. The referral rate reached 35% by 2024, making word-of-mouth the largest single acquisition channel. Churn fell from 20% to 12% between 2021 and 2024 — a decline that correlated directly with the improvement in NPS and the reduction in the detractor-to-promoter ratio. Engagement is the company's most reliable leading indicator of both retention and growth.
Connected dimensions
Engagement does not operate in isolation. Four dimensions connect most directly:
130 — Pains & Gains: Engagement drops when pains accumulate. The most reliable way to convert a promoter into a passive — or a passive into a detractor — is to leave a mapped pain unaddressed. Pains & Gains research identifies what to fix; Engagement measurement tracks whether fixing it is working.
510 — Listening (VOC): VOC systems feed engagement data. The feedback loop that makes engagement actionable requires a systematic listening infrastructure — not just NPS, but the full VOC stack that captures what customers say, where they say it, and at which stage of the journey.
630 — User Lifetime: Engagement predicts lifetime. The correlation between promoter status and customer lifetime value is well-established. A customer who actively recommends the brand has already demonstrated a level of commitment that translates directly into longer retention and higher ARPU.
520 — Stories: Engaged customers become storytellers. The most valuable content the brand can produce is a promoter's authentic account of why they use and recommend it. Engagement measurement identifies who those promoters are. Stories strategy gives them a stage.
Conclusion
Satisfaction is easy to achieve and easy to mistake for something more. A customer who rates the last service 7/10 and never comes back is satisfied. A customer who rates it 6/10, calls to say why, and stays for three more years after the issue is resolved is engaged.
The dimension that distinguishes between those two customers — and builds systems to identify, track, and act on the difference — is Engagement. It is the Customer meta-category's mechanism for translating everything upstream (JTBD clarity, aspiration alignment, pain elimination) into a measurable relationship.
For archetypes where brand loyalty is the strategic imperative — A3, A4, A7 — a low Engagement score is the diagnostic that explains why the strategy is not working, even when the product is sound. Fix Engagement, and the downstream metrics follow. Leave it unmeasured, and the churn signal arrives in the revenue line: accurate, too late, and expensive to reverse.
Sources
Frederick Reichheld, "The One Number You Need to Grow", Harvard Business Review, December 2003 — hbr.org
Stellafai, "6 Leading Indicators to Accurately Predict Renewal and Churn", 2025 — stellafai.com
Marketing Canvas Method, Appendix E — Dimension 140: Engagement, Laurent Bouty, 2026
About this dimension
Dimension 140 — Engagement is part of the Customers meta-category (100) in the Marketing Canvas Method. The Customers meta-category contains four dimensions: Job To Be Done (110), Aspirations (120), Pains & Gains (130), and Engagement (140).
The Marketing Canvas Method is a complete marketing strategy framework built around 6 meta-categories, 24 dimensions, and 9 strategic archetypes. Learn more at marketingcanvas.net or in the book Marketing Strategy, Programmed by Laurent Bouty.