M6–M9: How to Map Your Competitive Position and Read the Perceptual Map
In a Nutshell
M6 · Step 1 · Competitive MappingM6: Competitors
"Naming the enemies."
M6 identifies 3–5 key competitors in your M1 market and assigns each a strategic role. Roles describe how a competitor behaves within the M2 benefit set — not their company size. The role predicts how they will respond to your moves.
In a Nutshell
M7 · Step 1 · Competitive MappingM7: Price Per Unit
"The hard cost."
M7 records the actual shelf price of your product or service and each competitor's, expressed in the same unit. This is the raw number — not a perception score. The unit must be consistent across all competitors: price per visit, per seat, per 100g, per hour. Choose the unit customers naturally use to compare options in your M1 market.
In a Nutshell
M8 · Step 1 · Competitive MappingM8: Perceived Price
"The psychological weight."
M8 converts raw M7 prices into a normalised score on a −12 to +12 scale, showing how each competitor's price feels to customers relative to the market range. It makes prices from completely different markets directly comparable — and directly comparable to M9.
Cheapest
Easiest buy
Mid-market
Priciest
Hardest buy
In a Nutshell
M9 · Step 1 · Competitive MappingM9: Perceived Benefits
"The value signature."
M9 scores every competitor's performance across each M2 benefit on a −3 to +3 scale, then normalises the result to −12 to +12 — the same scale as M8. This makes benefit delivery and price directly comparable on the same map. Scores reflect customer perception, not your own assessment.
Step 2: Sum all benefit scores per entity
Step 3: M9 = (Sum × 4) ÷ Number of M2 benefits
Fails on
all benefits
Mid-range
delivery
Leads on
all benefits
You have defined your market (M1), identified what customers value (M2), established your market's lifecycle stage (M3), classified the depth of the exchange (M4), and quantified the opportunity (M5). You now know the battlefield and its rules.
The next four parameters — M6, M7, M8, and M9 — map who else is on that battlefield, what they charge, and how well they deliver on what customers care about. Together they produce a single analytical output: the Perceptual Map, which plots every competitor's price against their perceived benefit delivery on the same scale.
That map shows you in thirty seconds what months of competitive research often fail to surface: whether your price is justified by your benefits — and whether your competitors' prices are.
M6: Competitors — Naming the Enemies
M6 identifies 3 to 5 key competitors in your M1 market and assigns each a strategic role. The roles are not descriptions of company size — they describe how each competitor behaves within the M2 benefit set that defines competition in your market.
| Role | Definition | Behaviour |
|---|---|---|
| Leader | Excels across multiple M2 benefits; sets the standard | Defends position; incremental innovation |
| Challenger | Strong on select benefits; attacks the leader on specific dimensions | Aggressive pricing or repositioning |
| Game Changer | Disrupts with new benefits or a new model | Redefines customer expectations |
| Follower | Mimics leaders or challengers without meaningful differentiation | Competes primarily on price |
| Niche Player | Excels on 1–2 specific benefits; targets a distinct sub-segment | Owns a slice and defends it |
Why roles matter: The role tells you how a competitor will respond to your moves. A Leader defends. A Challenger attacks. A Game Changer ignores the existing rules. Knowing this shapes how you position against each one in Step 4.
Green Clean's competitive set:
| Competitor | Role | Description |
|---|---|---|
| Green Clean (Me) | Challenger | Sustainability focus, mid-price positioning |
| EcoPure | Leader | Premium eco-friendly, highest price, dominant on trust |
| NatureFresh | Follower | Budget eco option, low differentiation |
| CleanCo | Follower | Traditional cleaning, lowest price, no eco positioning |
One rule for M6: only include competitors your Lead Segment would actually consider. If your Lead Segment is eco-conscious urban homeowners, CleanCo (traditional cleaning) is at the edge of the competitive set — they are a reference point for pricing, but not the primary rival. Your M1 definition determines who belongs here.
M7: Price Per Unit — The Hard Cost
M7 records the actual shelf price of your product or service and each competitor's, expressed in the same unit. This is not perceived price — it is the raw number that appears on a price list or invoice.
The "unit" must be consistent across all competitors. For a cleaning service, the unit is price per visit. For packaged coffee, it is price per 100g. For B2B software, it is price per seat per month. Choose the unit that customers naturally use to compare options in your M1 market.
Green Clean's M7 pricing:
| Entity | M7 — Price per visit |
|---|---|
| CleanCo | $100 |
| NatureFresh | $140 |
| Green Clean | $200 |
| EcoPure | $260 |
| Range | Min PPU $100 · Max PPU $260 |
M7 feeds directly into the M8 formula. You need the highest price (Max PPU) and lowest price (Min PPU) in the competitive set to calculate where every player sits on the perceived price scale.
M8: Perceived Price — The Psychological Weight
M8 converts the raw M7 price into a normalised score on a −12 to +12 scale, showing how each competitor's price feels to customers relative to the rest of the market. The same €10 difference feels enormous in a market where all prices cluster between €8 and €12, and negligible in a market ranging from €50 to €500.
The M8 formula:
M8 = [24 ÷ (Max PPU − Min PPU)] × (M7 − Min PPU) − 12
Where:
Max PPU = highest price in the competitive set
Min PPU = lowest price in the competitive set
M7 = the entity's actual price per unit
The formula normalises all prices to a −12 to +12 scale regardless of absolute values. −12 is the cheapest option (easiest purchase decision). +12 is the most expensive (hardest purchase decision). 0 is the exact midpoint of the market.
Green Clean M8 calculation:
Max PPU (EcoPure): $260
Min PPU (CleanCo): $100
Green Clean M7: $200
M8 = [24 ÷ (260 − 100)] × (200 − 100) − 12 M8 = [24 ÷ 160] × 100 − 12 M8 = 0.15 × 100 − 12 M8 = 15 − 12 M8 = +3.0
Full competitive set — M7 to M8:
| Entity | M7 (Price/visit) | M8 (Perceived Price) | Reading |
|---|---|---|---|
| CleanCo | $100 | −12.0 | Cheapest — easiest purchase decision |
| NatureFresh | $140 | −6.0 | Affordable |
| Green Clean | $200 | +3.0 | Slightly above mid-market |
| EcoPure | $260 | +12.0 | Premium — hardest purchase decision |
Green Clean's +3.0 score is a precise competitive signal: it sits just above the midpoint, close to the market centre but with a slight premium lean. That positioning only makes strategic sense if M9 — perceived benefits — justifies it. Which is exactly what the Perceptual Map will show.
M9: Perceived Benefits — The Value Signature
M9 scores every competitor's performance across each M2 benefit on a −3 to +3 scale, then converts the sum to the same −12 to +12 scale as M8 — making price and benefits directly comparable on the Perceptual Map.
The M9 scoring process:
Take your M2 benefit list (the 5–7 benefits that define competition in your market)
Score every competitor — including yourself — on each benefit from −3 (completely fails to deliver) to +3 (leads the market on this benefit). No zero permitted: if a benefit is unclear, round to −1
Sum all scores per entity
Calculate M9: (Sum of scores × 4) ÷ Number of benefits
The multiplication by 4 and division by the number of benefits normalises the result to the −12 to +12 scale regardless of how many benefits you have identified in M2.
Green Clean M9 — full scoring table:
| Benefit | Type | Green Clean | EcoPure | NatureFresh | CleanCo |
|---|---|---|---|---|---|
| Effectiveness | Functional | +2 | +3 | +1 | +2 |
| Environmental | Sustainable | +3 | +2 | +2 | −1 |
| Health | Functional | +3 | +1 | +1 | −2 |
| Convenience | Functional | +1 | +2 | +2 | +3 |
| Trust | Emotional | +1 | +3 | +1 | +1 |
| Sum | 10 | 11 | 7 | 3 | |
M9 calculation (5 benefits):
| Entity | Calculation | M9 Score |
|---|---|---|
| Green Clean | 10 × 4 ÷ 5 | +8.0 |
| EcoPure | 11 × 4 ÷ 5 | +8.8 |
| NatureFresh | 7 × 4 ÷ 5 | +5.6 |
| CleanCo | 3 × 4 ÷ 5 | +2.4 |
Green Clean's M9 of +8.0 is nearly identical to EcoPure's +8.8 — the market leader on perceived benefits. But EcoPure charges +12.0 on perceived price. Green Clean charges +3.0. That gap is the strategic insight the Perceptual Map makes visible.
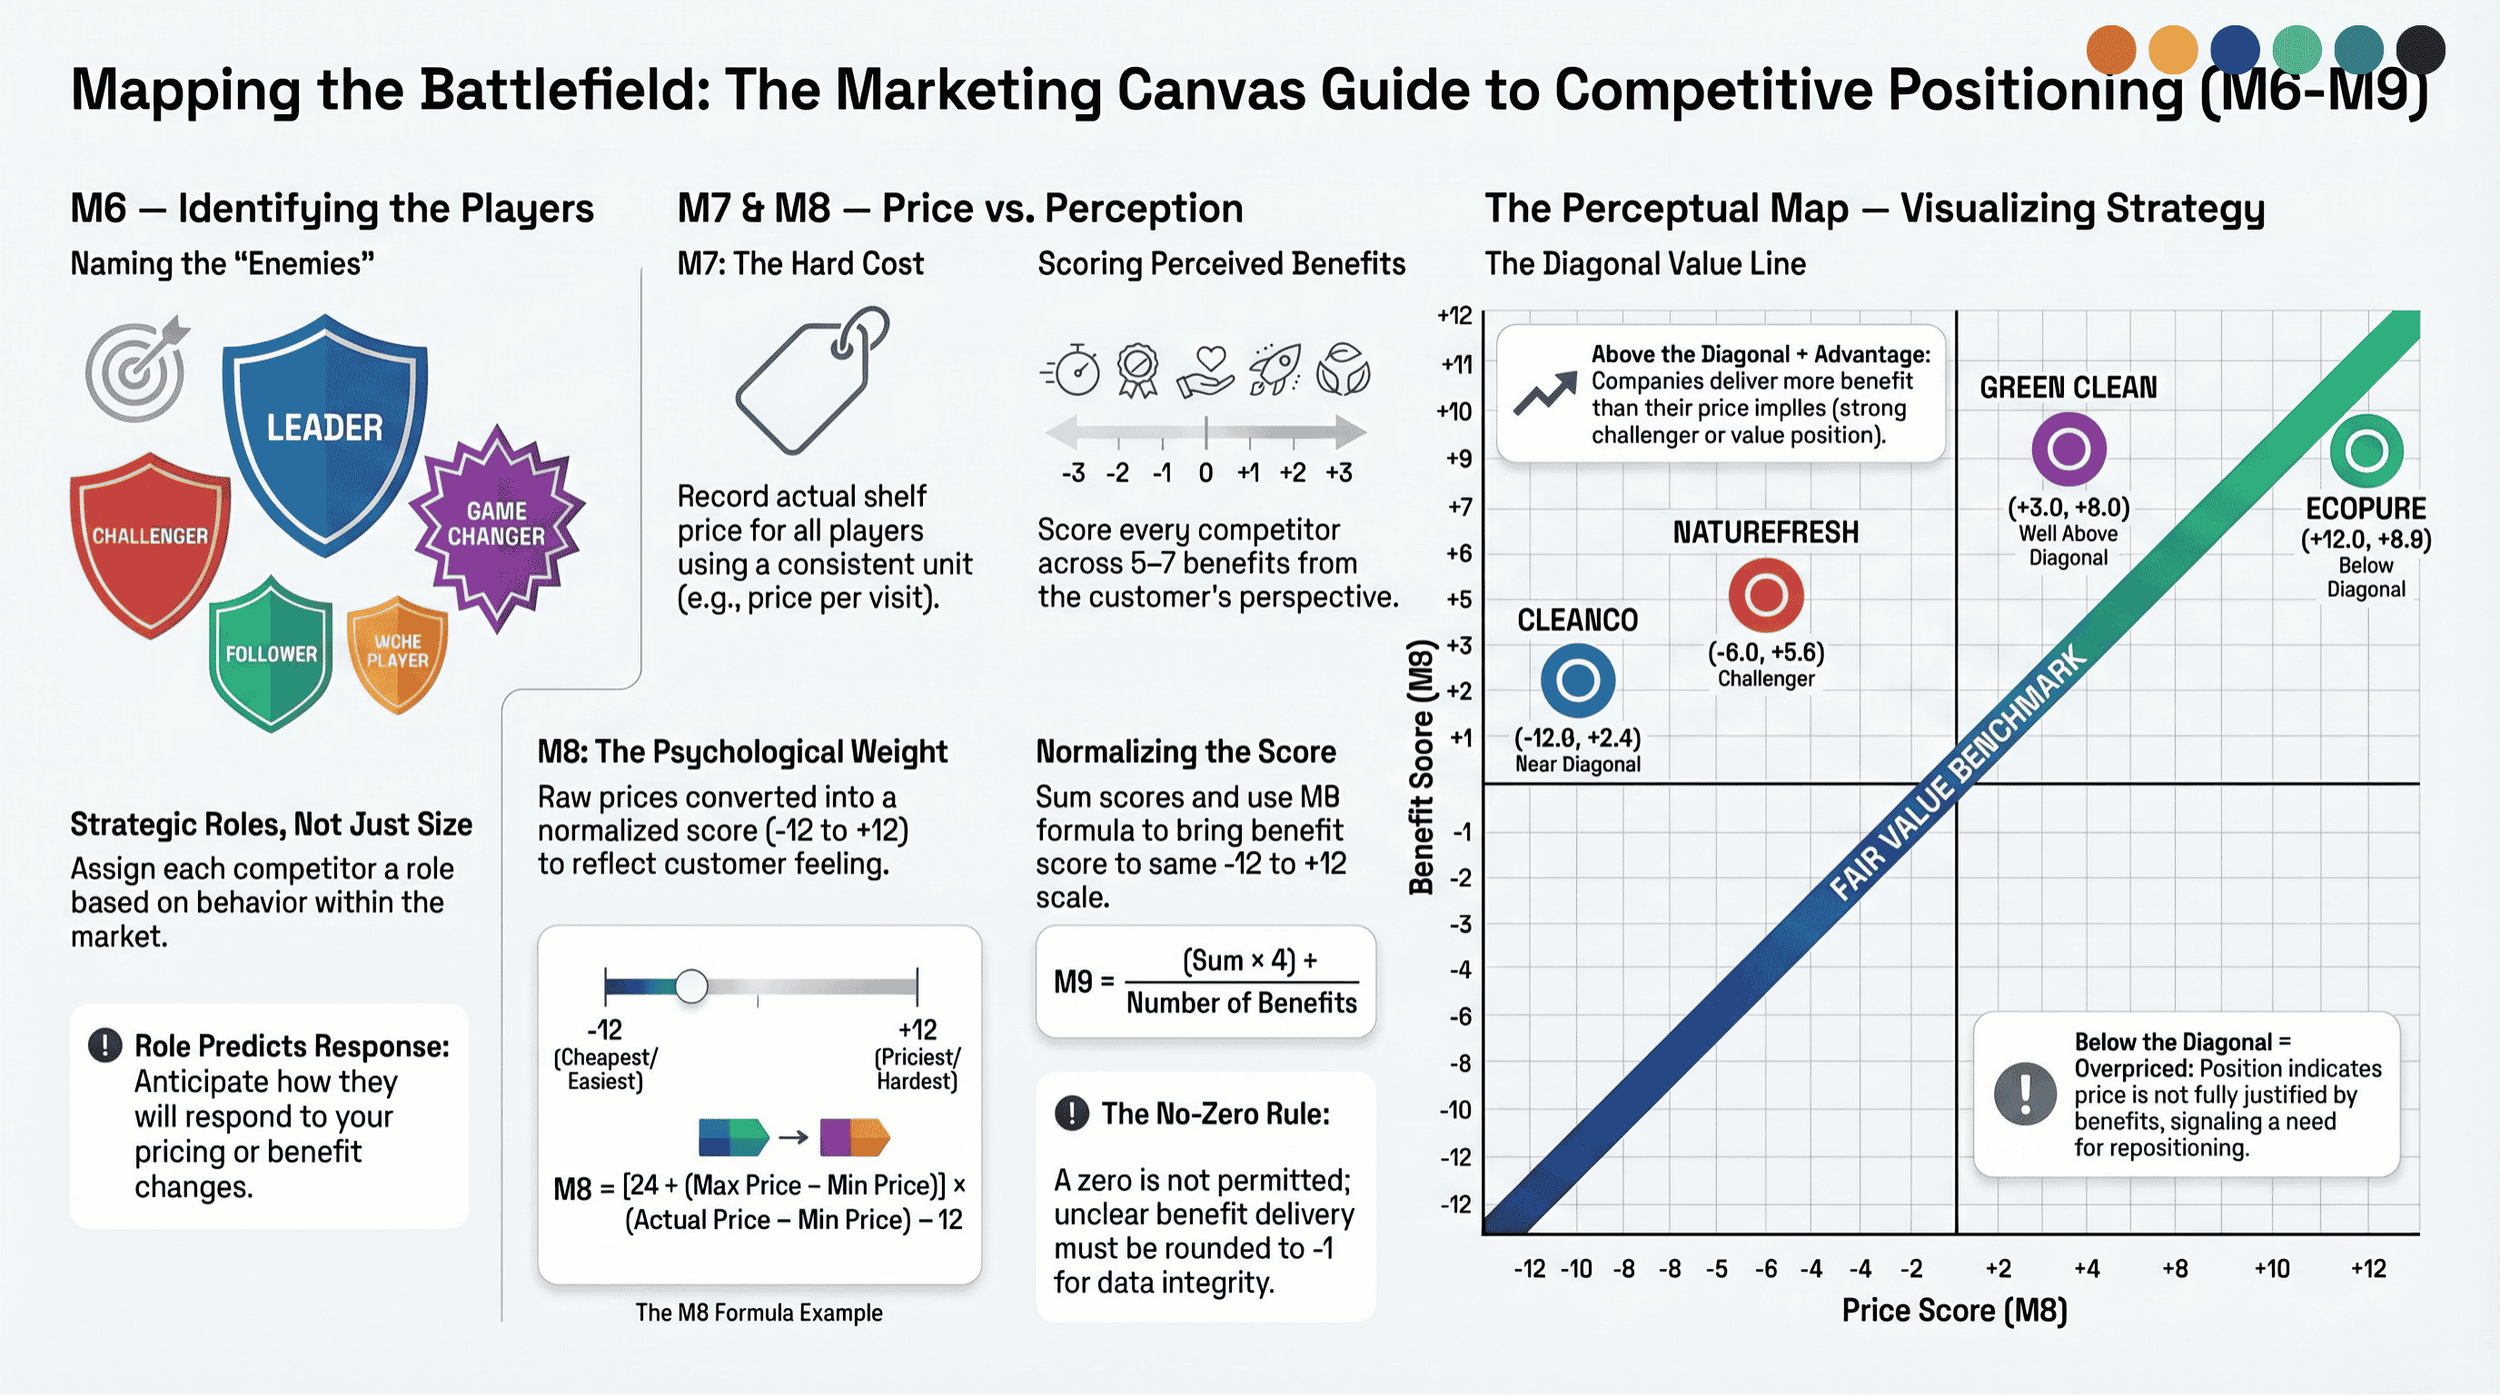
The Perceptual Map: M8 vs. M9
The Perceptual Map plots M8 (Perceived Price) on the horizontal axis against M9 (Perceived Benefits) on the vertical axis. Both axes run from −12 to +12. Every competitor becomes a single point on the map.
The diagonal is the value line — the set of positions where perceived benefits exactly match perceived price. Companies above the diagonal deliver more benefit than their price implies. Companies below it charge more than their perceived benefit justifies.
Green Clean's Perceptual Map:
| Entity | M8 — Price | M9 — Benefits | Position vs. diagonal |
|---|---|---|---|
| CleanCo | −12.0 | +2.4 | Near diagonal — low price, low benefits |
| NatureFresh | −6.0 | +5.6 | Above diagonal — fair value, limited differentiation |
| Green Clean | +3.0 | +8.0 | Well above diagonal — strong challenger advantage |
| EcoPure | +12.0 | +8.8 | Below diagonal — premium price not fully justified by benefits |
| Map reading | Above diagonal = good value. Below diagonal = overpriced relative to perceived benefit. | ||
The strategic insight: Green Clean delivers nearly the same perceived benefits as EcoPure (+8.0 vs +8.8) at a dramatically lower perceived price (+3.0 vs +12.0). It sits well above the diagonal — strong value for its price point. EcoPure, despite leading on perceived benefits, sits slightly below the diagonal: its +12.0 price is hard to fully justify against a +8.8 benefit score when Green Clean offers +8.0 at +3.0.
This is the classic challenger advantage. It also shows where Green Clean's vulnerability lies: if it raises prices to capture more margin, it moves rightward on M8. To maintain its above-diagonal position at a higher price, M9 must rise proportionally — which means investing in the dimensions where it trails EcoPure (Trust: +1 vs +3, Convenience: +1 vs +2).
That investment decision belongs in Steps 3 and 4. M6–M9 surfaces the gap. The Vital 8 closes it.
The Marketing Canvas Guide to Competitive Positioning (M6-M9)
What M6–M9 Feeds Downstream
The four competitive mapping parameters produce three specific inputs to the rest of the method:
Into Archetype Selection (Step 2): M8 and M9 together show your competitive position — whether you are a challenger, a premium player, a value option, or a commodity competitor. That context informs the revenue goal you set in Step 2, which triggers Archetype Selection alongside M3 and M4.
Into Step 3 scoring: The M9 benefit scores for your own company are the starting point for your dimension assessment. A +1 on Trust in the M9 table signals a potential Brake on dimension 140 (Customer Engagement) or 340 (Proofs) depending on your archetype. The competitive context makes individual dimension scores meaningful.
Into Step 4 prioritisation: Knowing that EcoPure scores +3 on Trust while you score +1 identifies a specific competitive gap to close — not as a general aspiration, but as a scored, named dimension with a target attached to it.
The Three Rules for Valid M6–M9 Scoring
Rule 1 — Score from the customer's perspective, not yours. M9 benefits are scored based on how your Lead Segment perceives each competitor's delivery — not on what you believe about your own product. Use customer research, reviews, NPS data, and sales call transcripts. Your internal view of your own performance is systematically biased upward.
Rule 2 — Keep the competitive set consistent. Every entity in M6 must be scored in M7, M8, and M9. A competitor that appears in M6 but is missing from the M9 table produces an incomplete Perceptual Map. The map only works if every relevant player is plotted.
Rule 3 — M2 drives M9, not the other way around. The benefit columns in M9 are your M2 list — the benefits that define competition in your M1 market. Do not add new benefits in M9 that you did not identify in M2. If a benefit matters enough to score in M9, it was important enough to include in M2.
◆ Practitioner's Tip
The two scoring errors that corrupt the Perceptual Map
The M9 scoring exercise looks straightforward until you run it with a real team for the first time. Two errors appear almost every session, and both corrupt the Perceptual Map in ways that produce wrong strategic conclusions.
The first is scoring your own company generously and competitors harshly. Teams routinely give themselves +3 on dimensions where customers would give them +1, and give competitors −2 where an honest market read would give them +1. The result is a Perceptual Map that flatters you. It feels good and it is useless. Force the team to score from evidence — customer reviews, NPS verbatims, sales call objections, churn reasons. If you cannot cite a source for a +3, it is not +3.
The second error is scoring benefits that are not in M2. Someone inevitably adds a benefit mid-session — "we should score innovation" or "what about after-sales support?" If it was not in M2, it does not belong in M9. Adding it now changes the M9 formula output for every entity and invalidates any comparison with the M2 benefit analysis. If the benefit genuinely matters, stop the session, update M2, and restart M9. Do not patch M9 without updating M2.
Get both right and the Perceptual Map produces the clearest strategic picture available from external data alone — before you have spent a single hour on internal dimension scoring.
M9 scoring rule 2: Only score M2 benefits. Adding new benefits mid-session invalidates the map.
Run Your Own Competitive Map
Start with your M2 benefit list from the M1+M2 article. Without that list locked, M9 scoring is arbitrary. Once you have it, the M6–M9 exercise takes one focused workshop session of two to three hours.
The Quick Assessment surfaces your initial competitive position in under ten minutes as a starting point.
Take the Quick Assessment (free) →Explore the full method →
Example: GreenClean vs. Competitors (M10)
Greenclean: Challenger with a sustainability focus, offering affordable alternatives to premium eco brands.
EcoPure: Leader in premium eco-friendly solutions.
NatureFresh: Budget competitor, lacks differentiation.
Final thoughts
Understanding your competitors goes beyond pricing and benefits. This process helps identify gaps in the market, refine your positioning, and strengthen your value proposition. By analyzing perceived price and benefits, you can develop strategies that resonate with your target audience while staying ahead of competitors.
As seen with Tesla, a high perceived price can align with high perceived benefits to justify a premium position. Similarly, GreenClean shows how affordability and sustainability can differentiate a product in a price-sensitive market. Use these methods to assess your landscape and uncover opportunities to lead.
What strategies have worked for you in understanding competitors? Share your experiences and insights in the comments!