Marketing strategy that works
in the real world.
Framework deep-dives, archetype guides, and research analysis built on the 24 dimensions of the Marketing Canvas Method.
Don't know your archetype yet?
12 minutes. 24 dimensions scored on a forced-choice scale. You get your Strategic Archetype, your Vital 8 against target, and your Fatal Brakes flagged — before you read anything else.
Get the scoring worksheets.
6 printable A4 scoring grids for running the MCM assessment with your team — no screen required.
No sales emails. GDPR-compliant. Unsubscribe any time.
Anthropic vs. the Three Competitive Axes
Most AI market commentary frames competition as a three-way race between Anthropic, OpenAI, and Google. The Marketing Canvas Method reveals a different picture: six players across four economic-value positions, running four different strategic archetypes, pressuring Anthropic along three axes simultaneously. The most consequential competitor is not who you think.
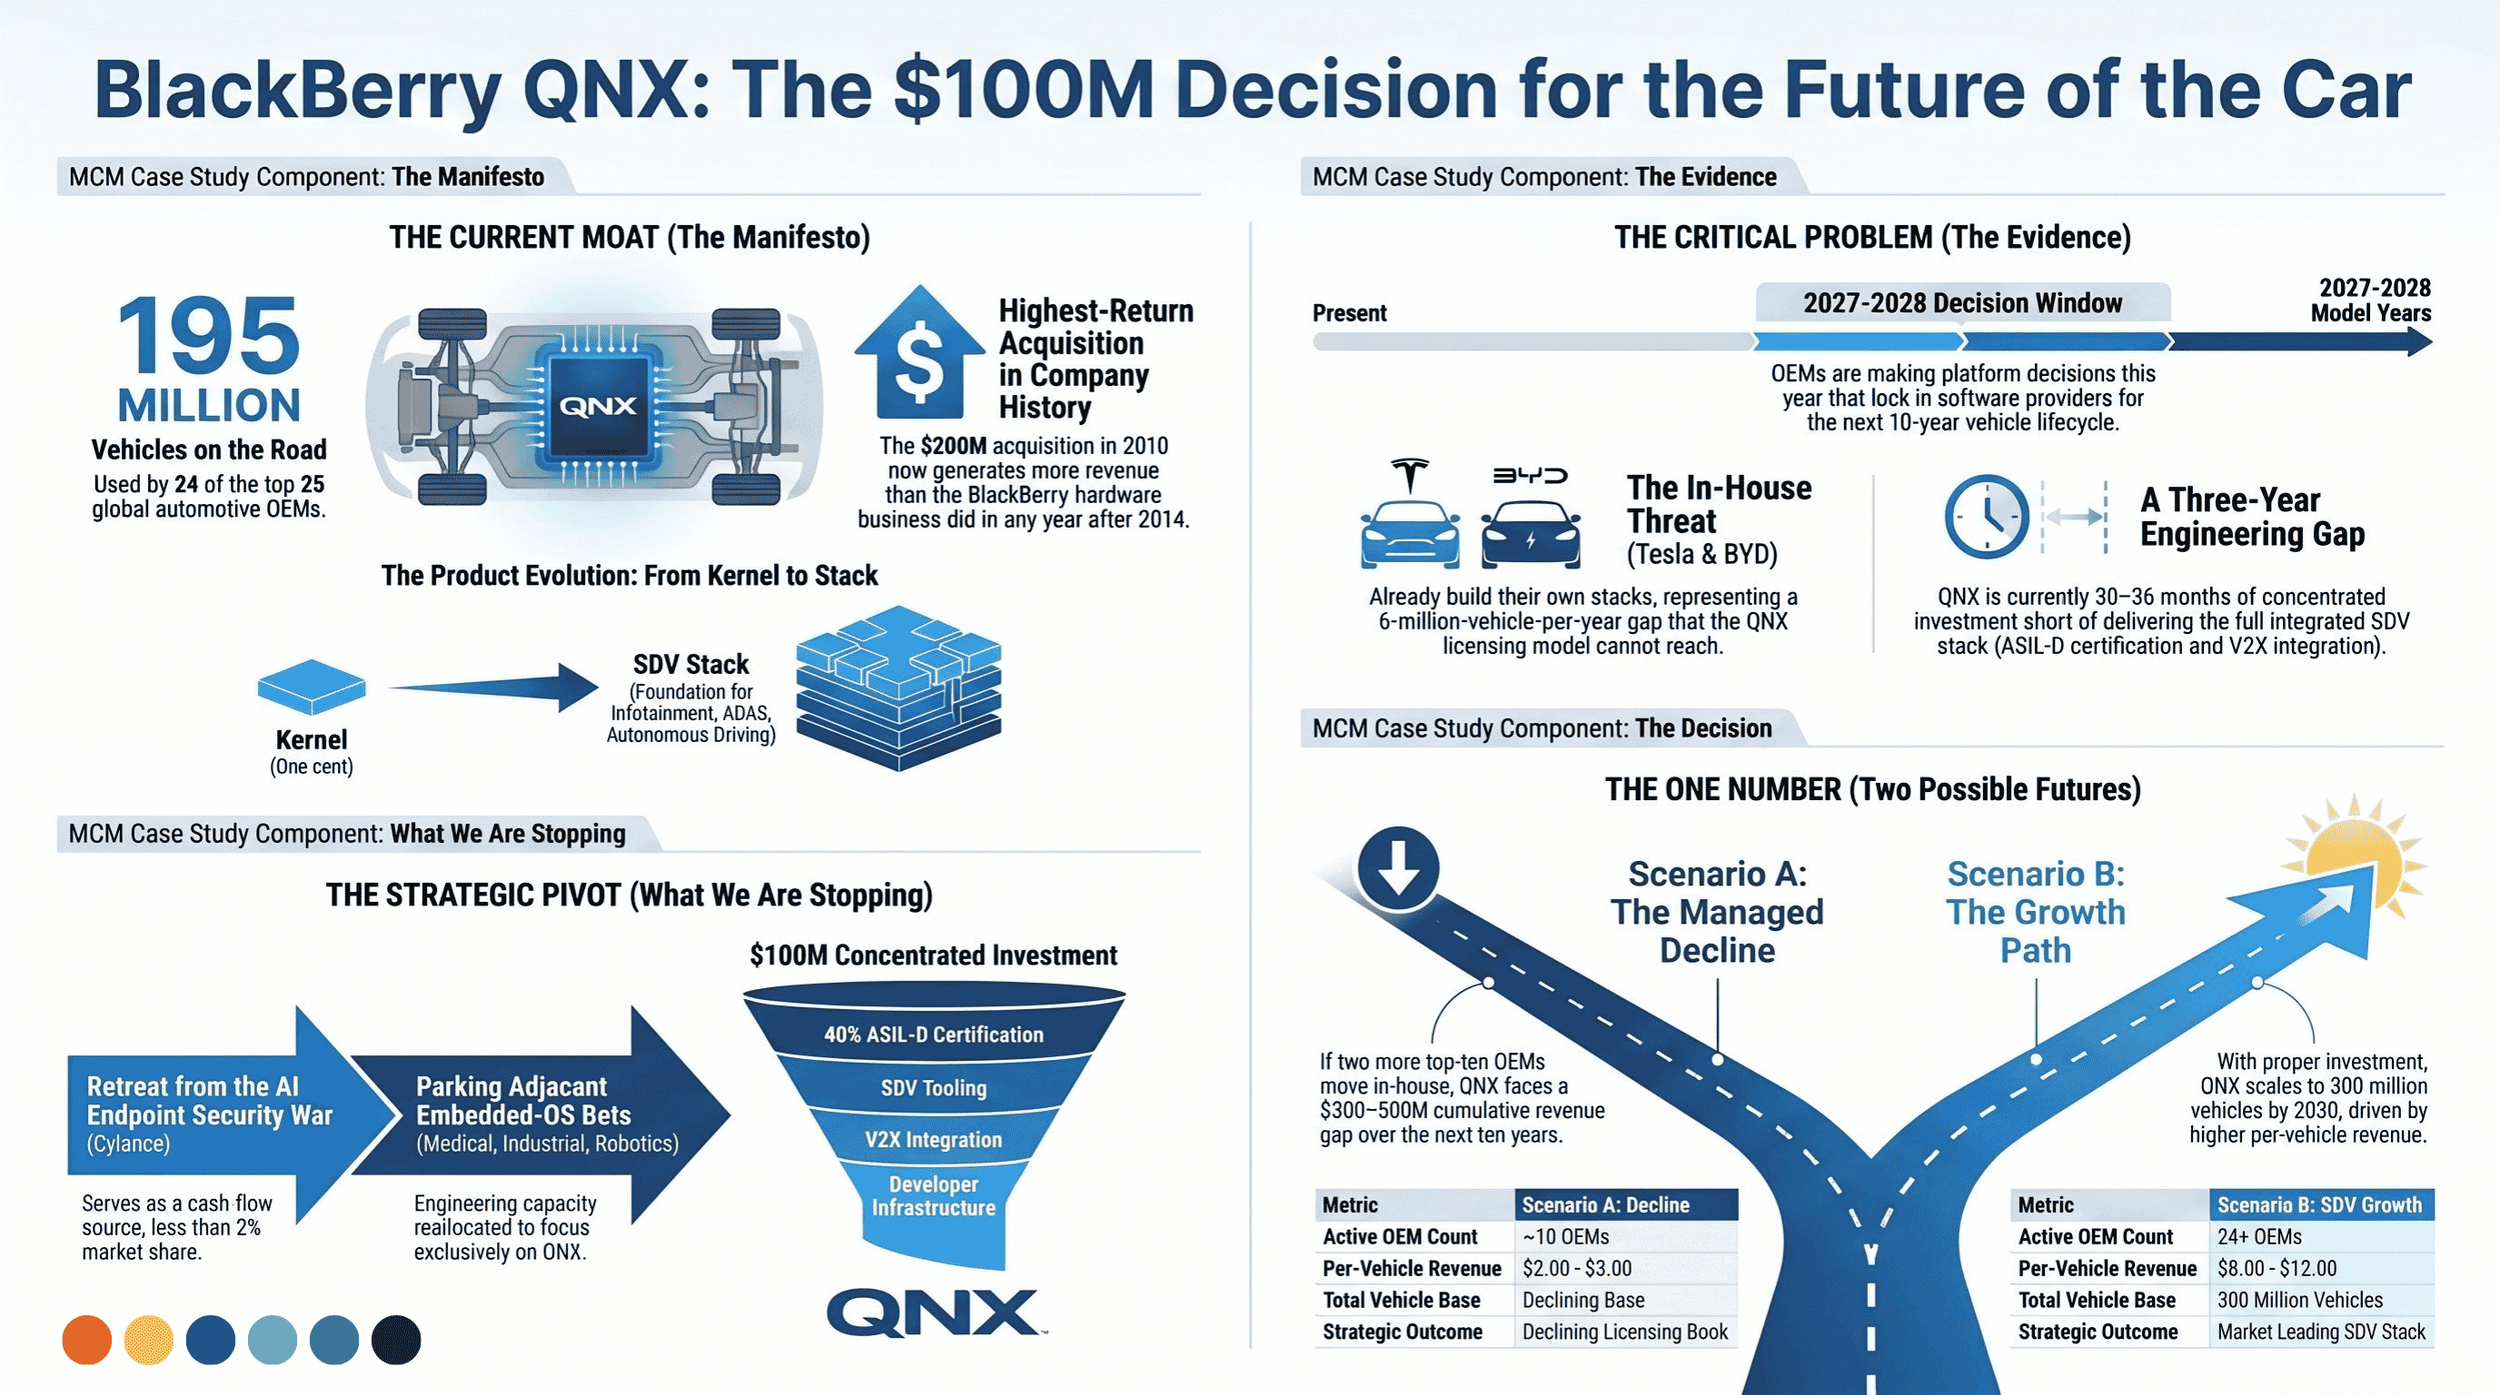
BlackBerry — A Brutal Clarity Memo on QNX
BlackBerry's QNX operating system runs in 195 million cars and is licensed by 24 of the top 25 automotive OEMs. Tesla and BYD chose to build their own. Three of the top ten OEMs are deciding right now whether to follow them. A two-page board memo on the $100M capital-allocation decision that cannot wait.
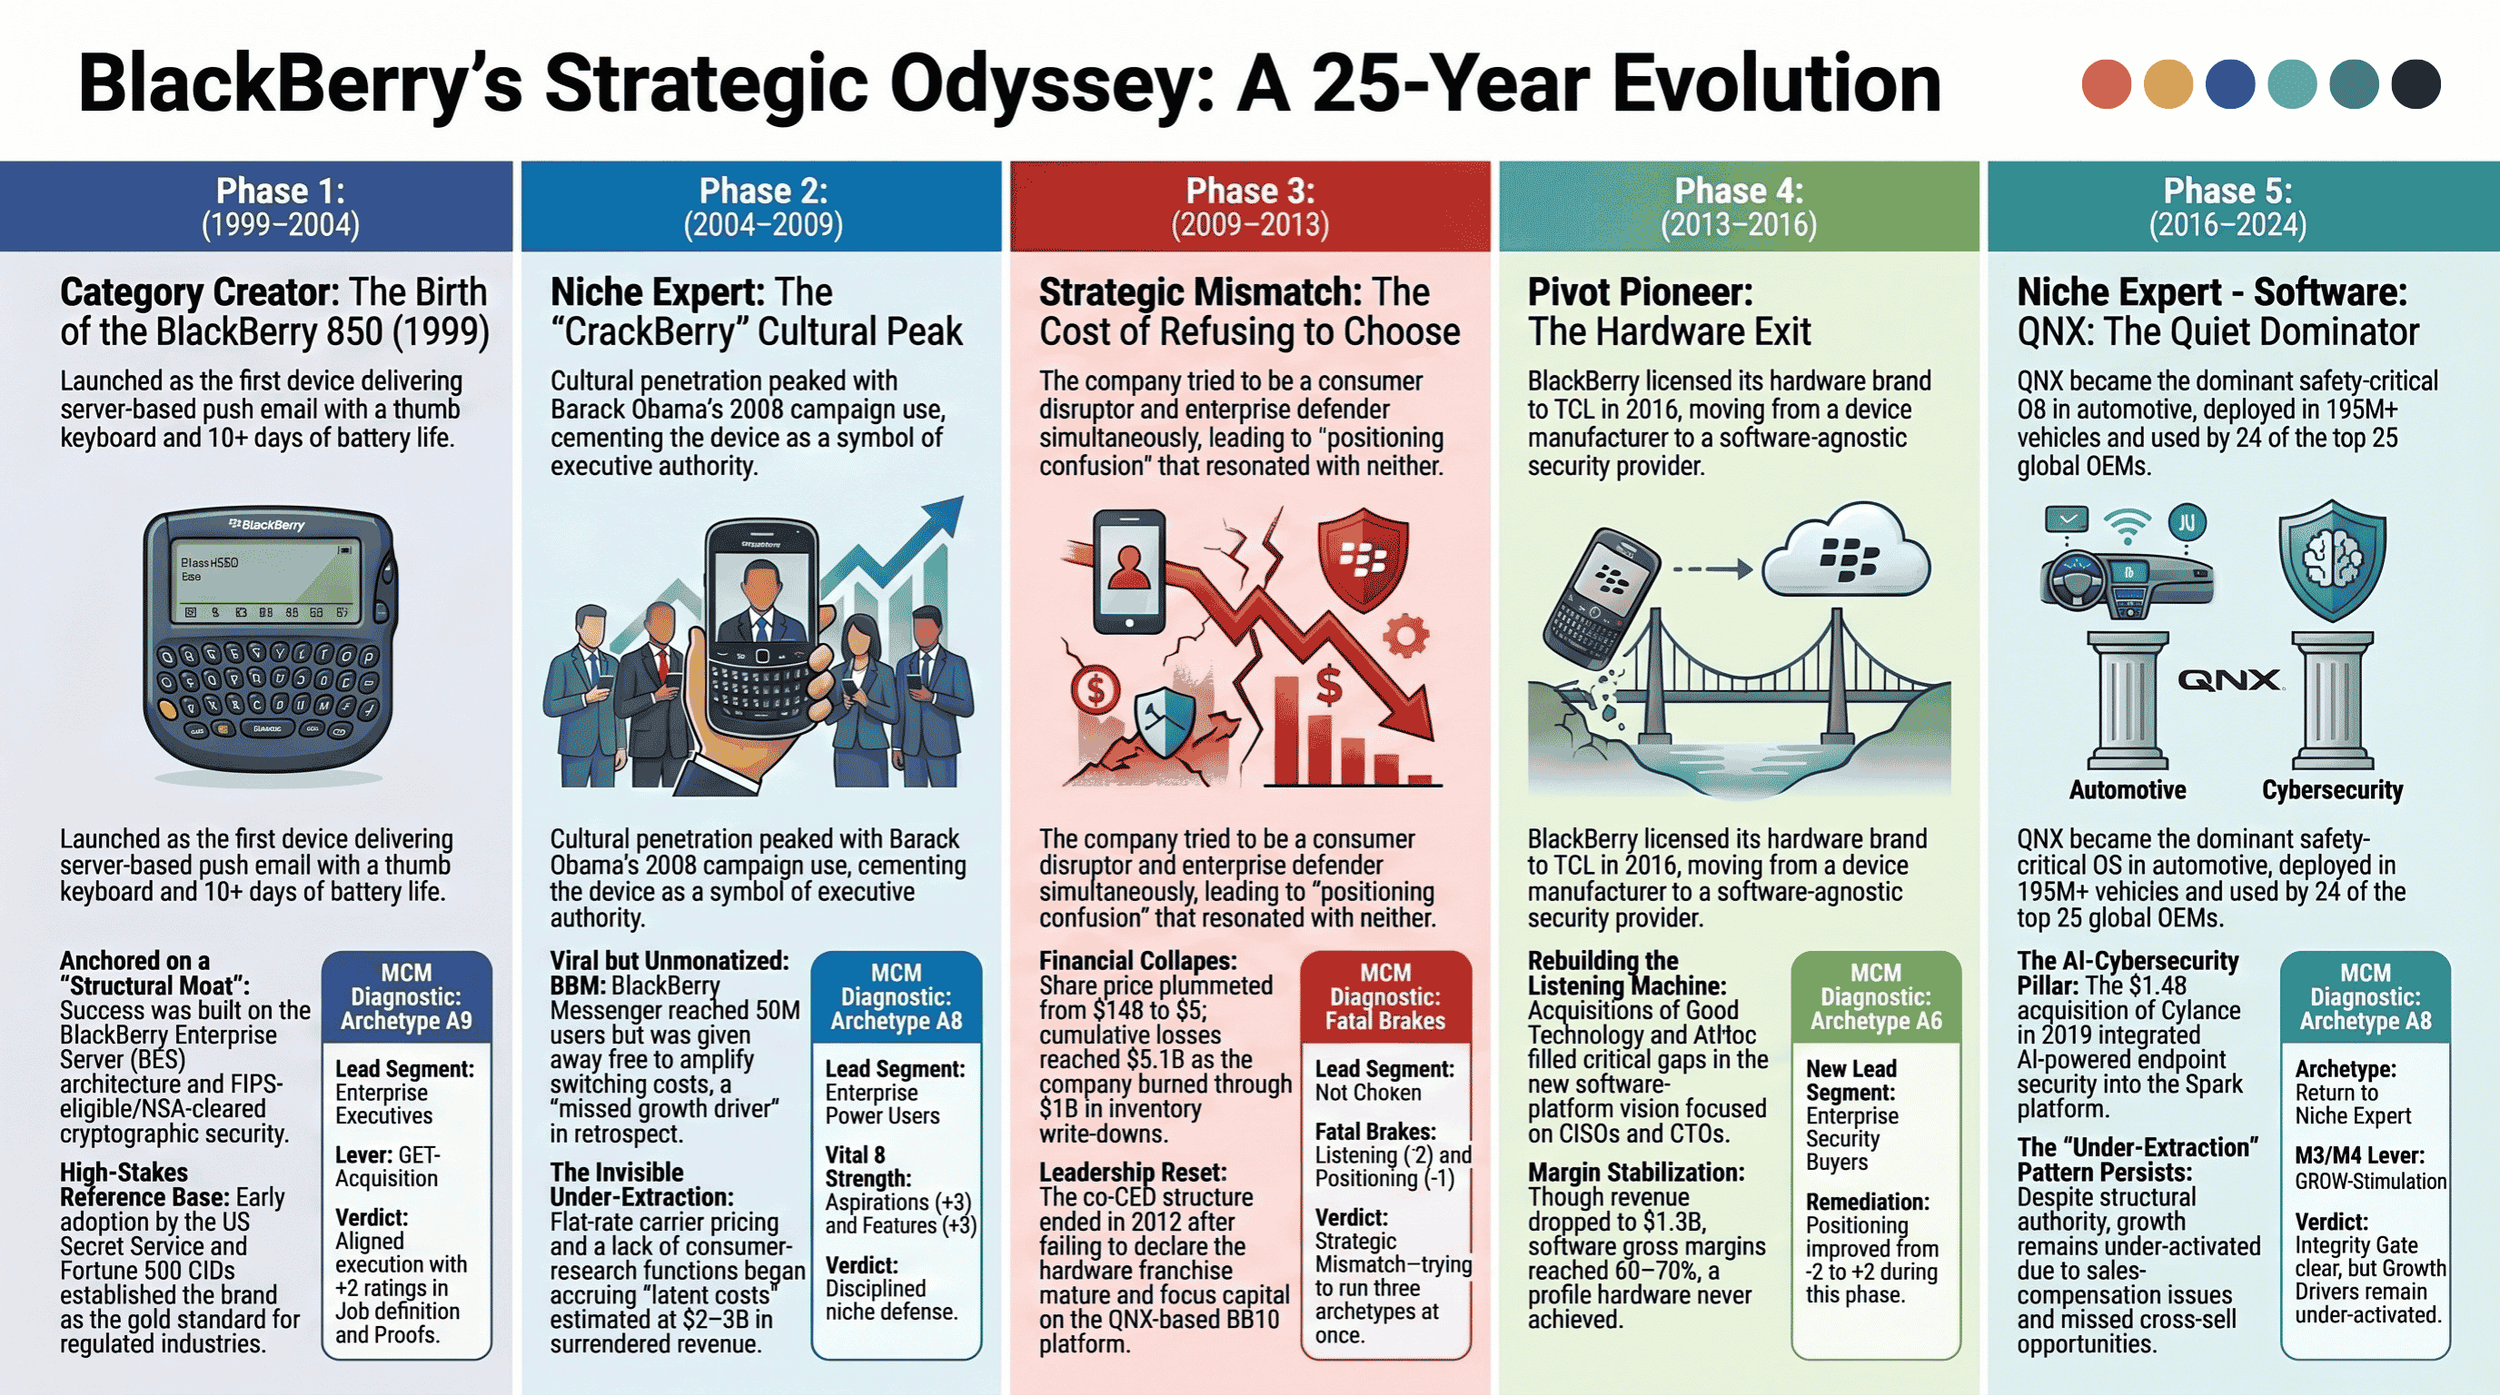
BlackBerry — A Strategic History Memo, 1999–2024
The complete v5.0 evidence base for BlackBerry's 25-year strategic evolution. Five archetype phases from 1999 to 2024 captured with Vital 8 scoring, Mechanism Maps, Operating Baseline reconstruction at three anchor moments, and falsifiable Step 4 anatomy. Q-tier sourcing throughout. For practitioners and auditors.
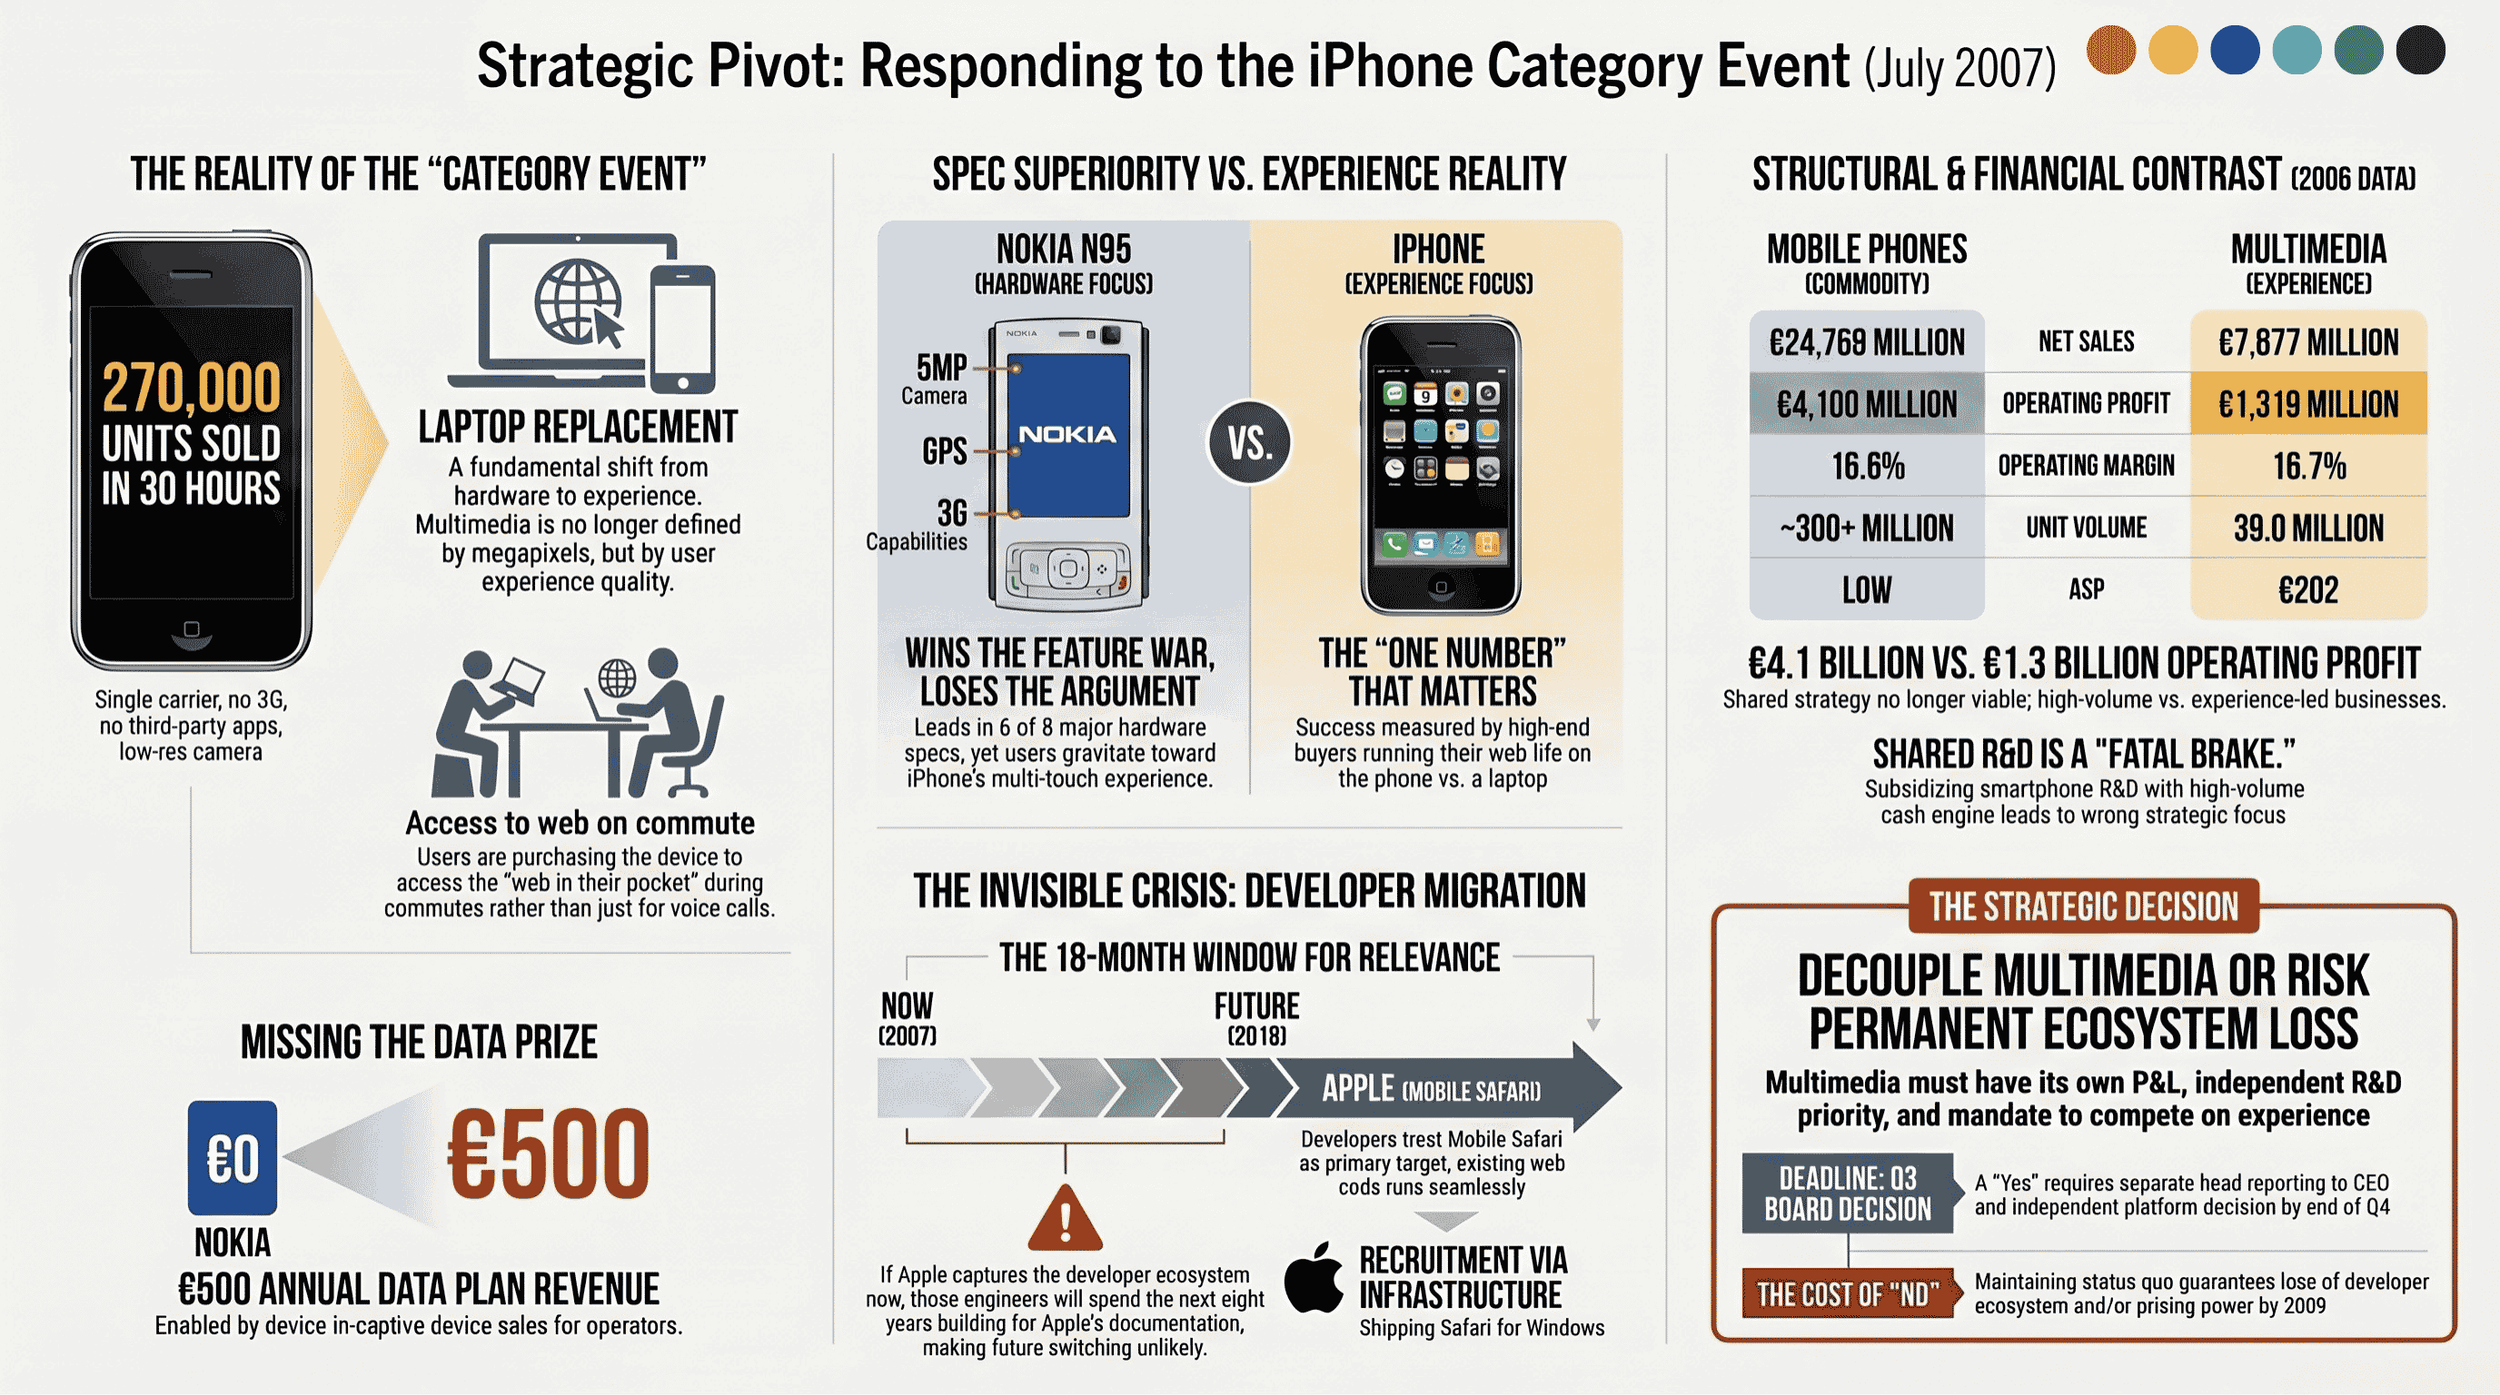
Nokia and the iPhone: The Memo Never Written, July 2007
What Nokia's CEO should have read on 30 July 2007 — one month after the iPhone launch. A Brutal Clarity Memo written using only data publicly available at the time. No hindsight permitted.
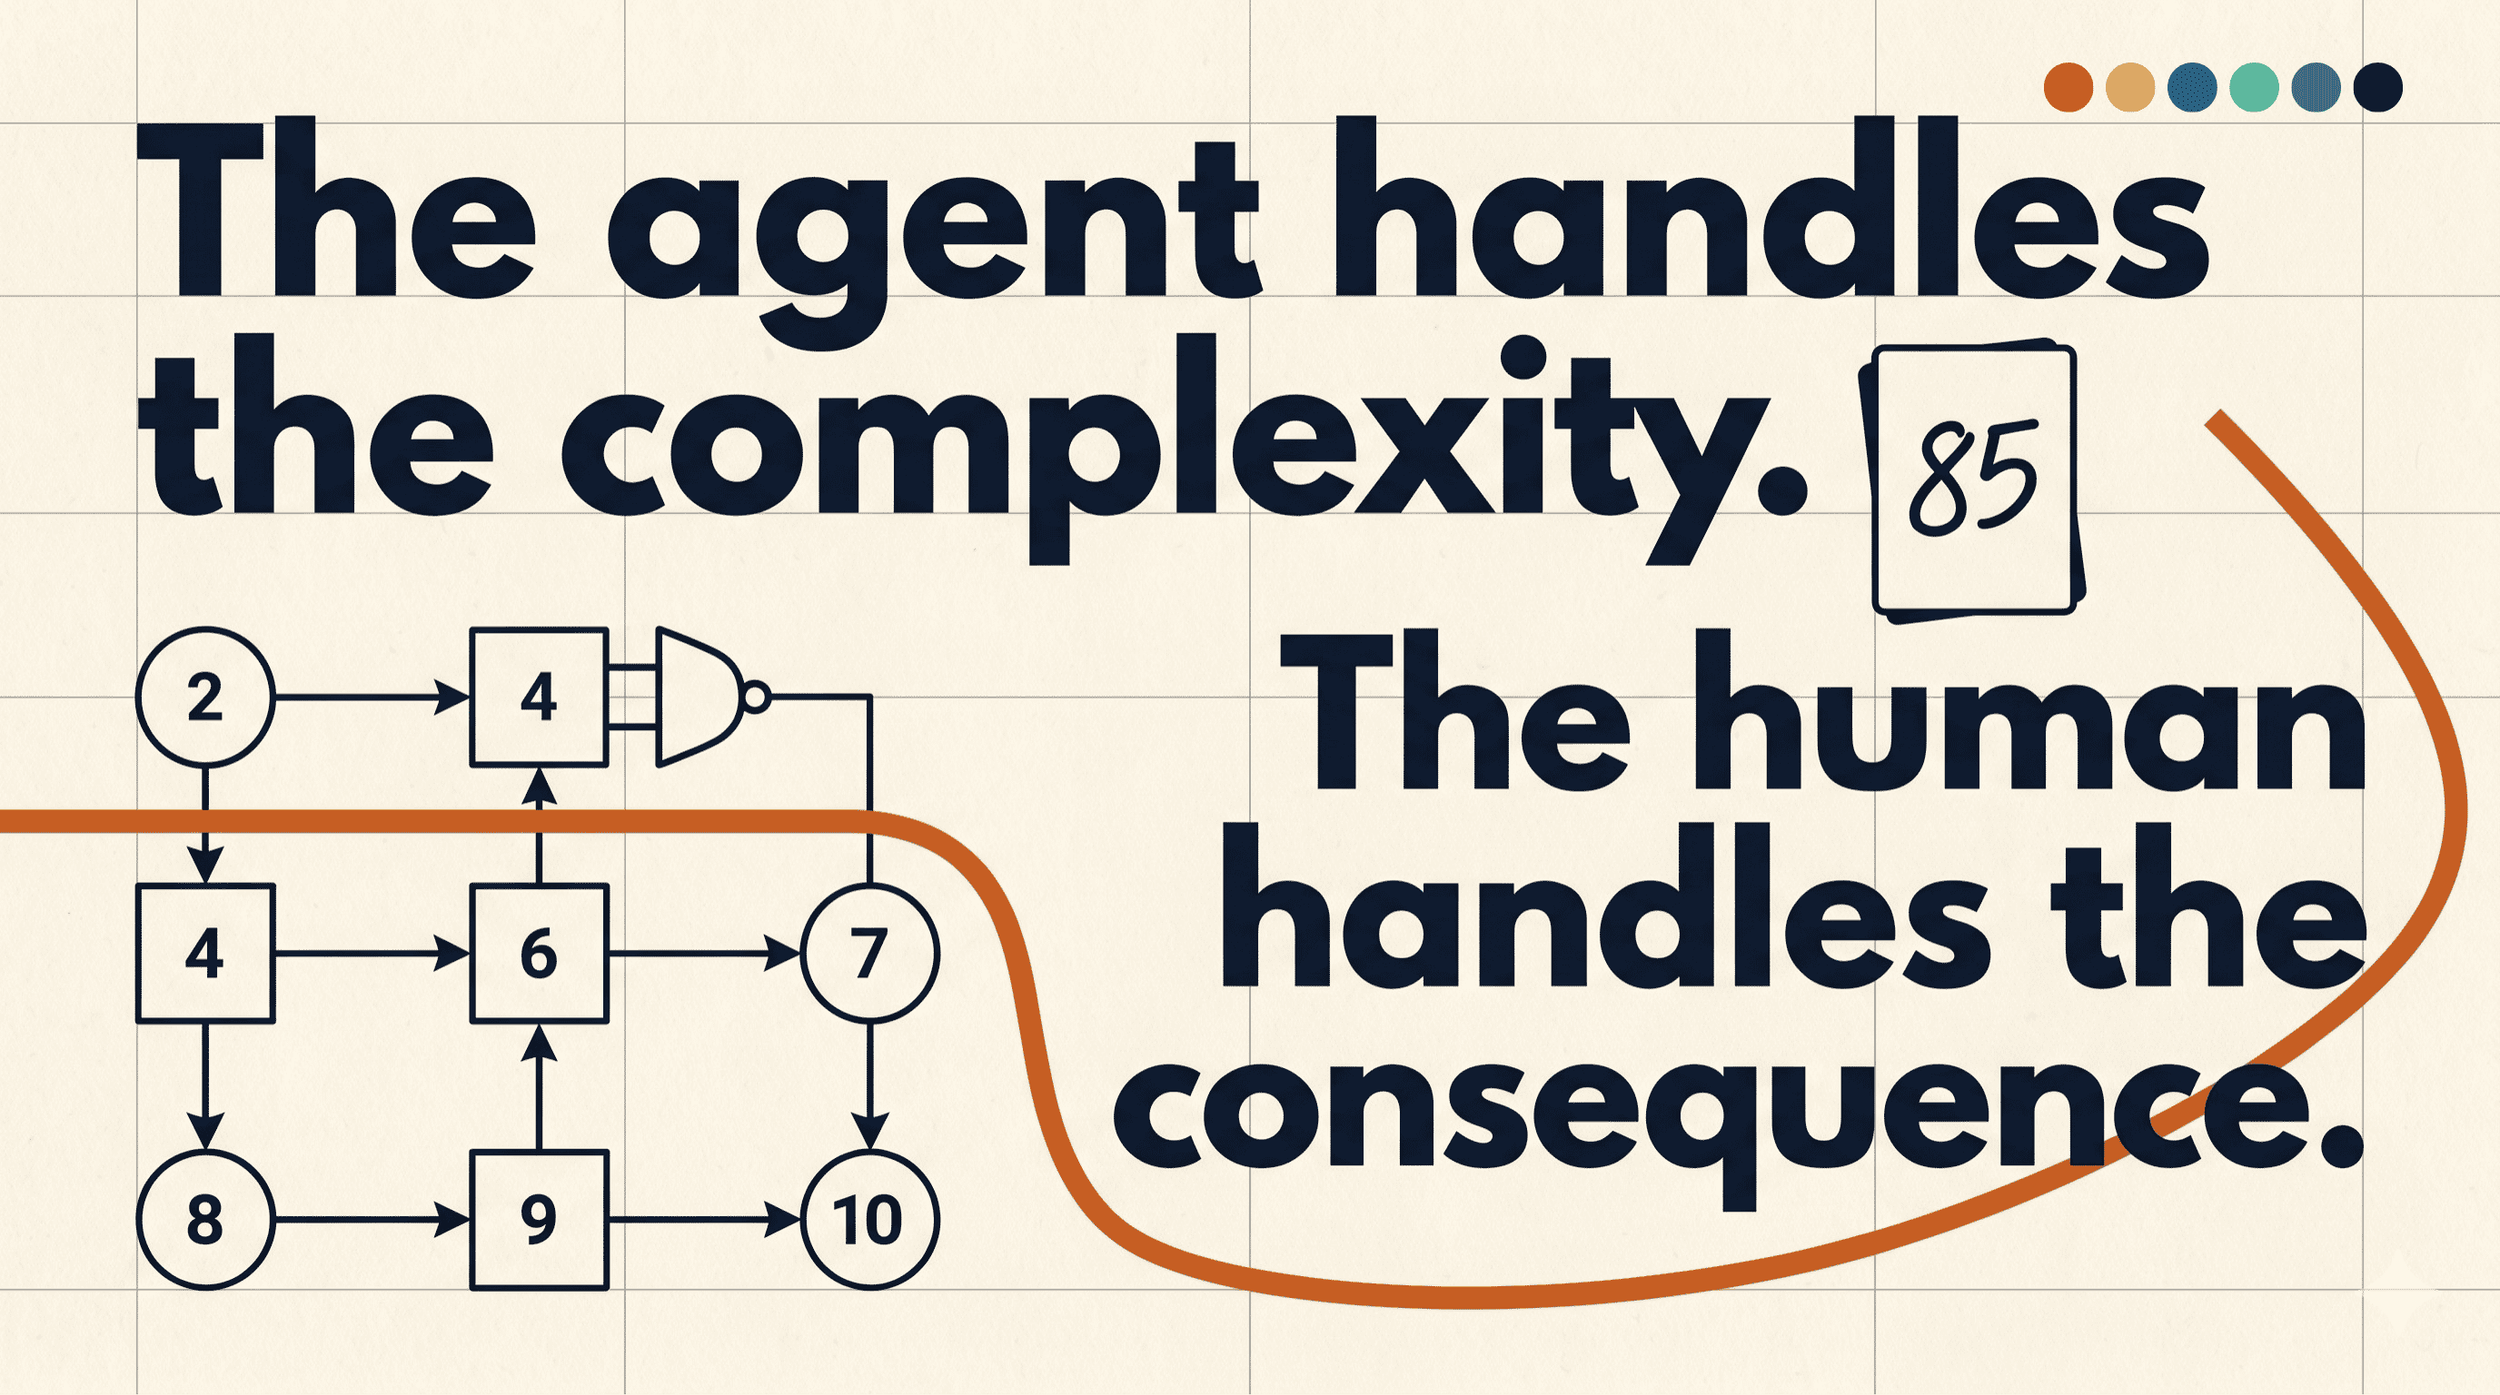
Marketing Strategy in an Agentic World
AI agents are now completing transactions on behalf of consumers — without visiting your website, reading your reviews, or seeing your ads. Your brand is being represented, recommended, or overlooked by systems you don't control. Most marketing frameworks weren't built for that. The Marketing Canvas Method was.

The MCM Greenwashing Integrity Check: Score with Evidence (7/7)
The MCM Integrity Check scores sustainability twice: once as claimed, once as evidenced. The gap between the two — in either direction — is the strategic risk to manage.

Purchase vs Participation: Two Modes of Sustainable Marketing (6/7)
Purchase-mode and participation-mode sustainability demand different strategies, scoring criteria, and evidence standards. Here is the MCM framework for both.

The MCM Sustainability Score: 19 Questions, One Diagnostic (4/7)
19 questions across five meta-dimensions. Here is the full structure of the MCM Sustainability Score — and where the most common scoring errors occur.

How to Tell If a Brand Is Truly Sustainable or Just Claiming (3/7)
There is a simple test for whether a company's sustainability marketing is genuine or cosmetic. It uses two scores — and most companies only track one.

The MCM Sustainability Compass: A Two-Axis Diagnostic Framework (3/7)
Commercial performance and sustainability are independent. The MCM Compass maps both — and shows why measuring only one misreads your position.

The Intention-Action Gap — For Marketing Leaders (2/7)
65% of consumers declare sustainability intent. 26% act. The gap is not a communications problem — it is a measurement system failure. Here is what to do about it.
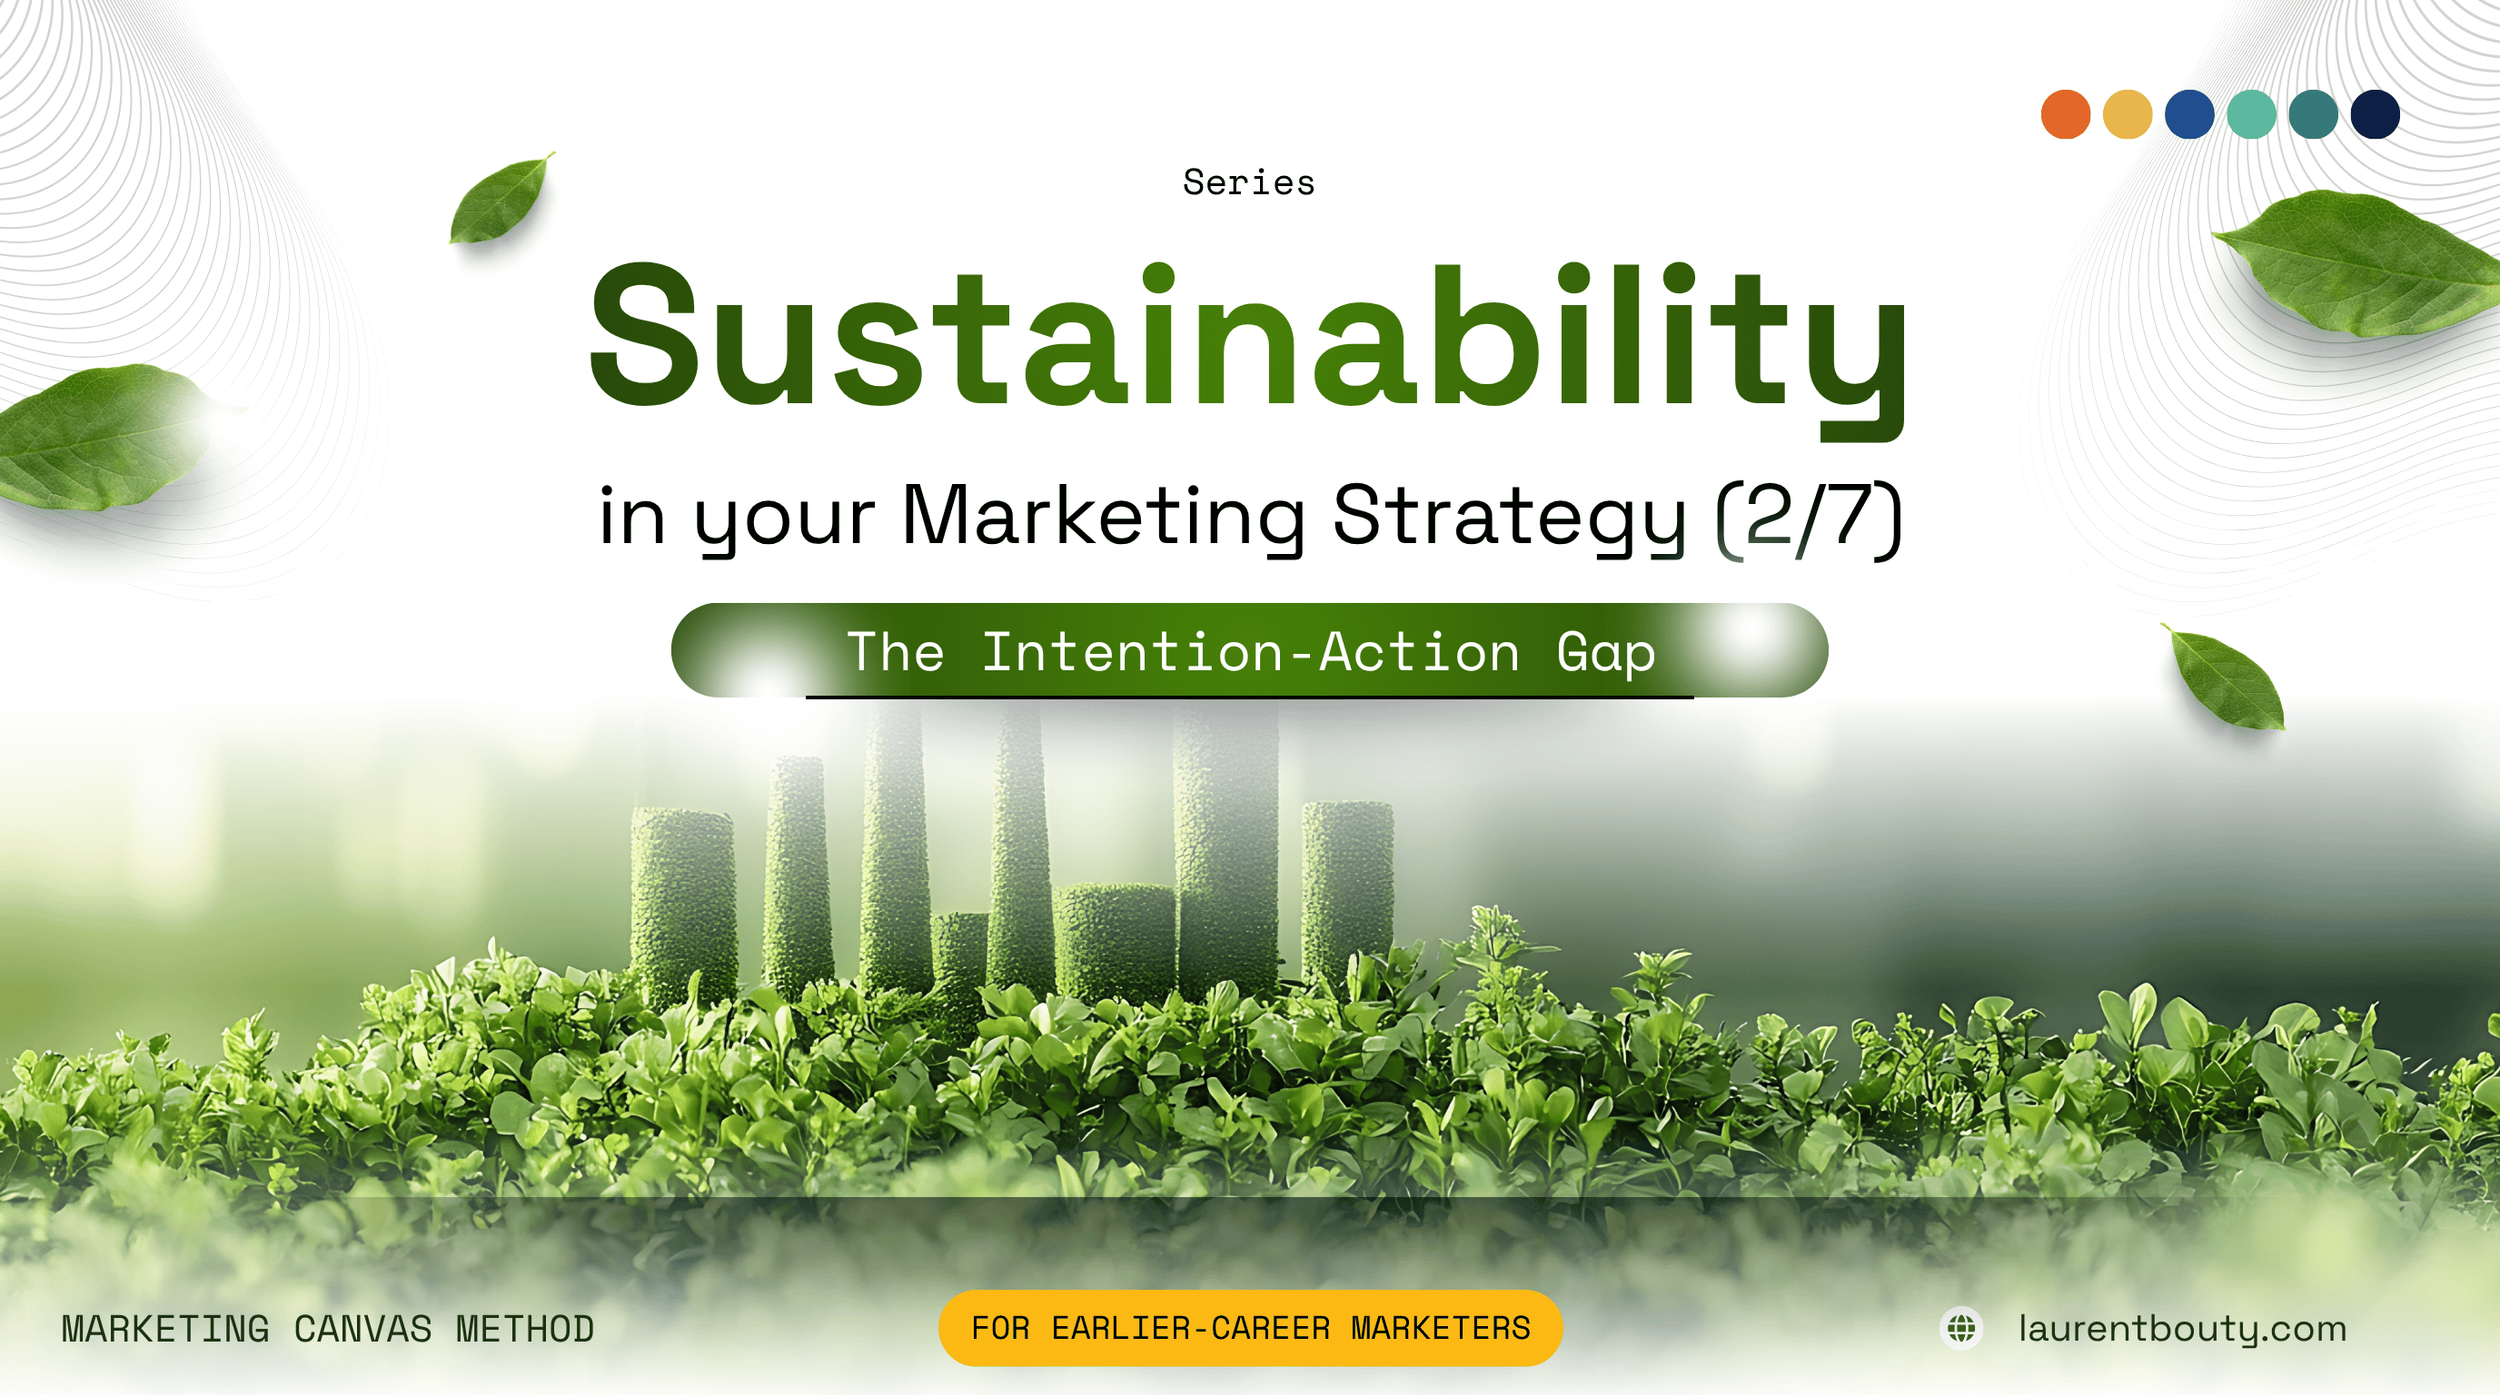
The Intention-Action Gap (2/7)
Customers say they want sustainable brands. Most don't buy them. Here's what that gap means for your work — and the one measurement shift that changes everything

McKinsey Just Mapped How 1-in-7 Companies Win. Here's What the Structured Analysis Actually Shows.
McKinsey found 61 outperformers in 5,000 companies. MCM shows the mechanism: all 8 Vital 8 above target simultaneously. Five bottom-up parameter assessments.

HBR's Sustainability Research — What the MCM Compass Shows
HBR's five sustainability research papers converge on one finding: pioneers set structured targets, not broad commitments. The MCM Sustainability Compass maps four strategic positions — and shows which company is operating in the wrong one. Table + assessment included.

Why the Marketers Who Get Promoted Ask Different Questions in Strategy Meetings
McKinsey studied 5,000 companies. The most useful finding for your marketing career isn't about strategy — it's about execution discipline. Here are three habits that make it actionable from your next meeting onward.

Your Brand's Biggest Marketing Problem Just Got Automated.
Acar & Schweidel's HBR research on agentic AI maps directly onto six MCM dimensions. Here's the precise translation — and what you should do about each one.

Your Customers Don't Buy Your Product. They Buy Who They're Becoming.
B. Joseph Pine II's new HBR article maps four customer aspiration types. The Marketing Canvas Method was built on this logic. Here's how to use it to score your strategy.
What Europe's Top CMOs Prioritise in 2026 — and How to Contribute Earlier
McKinsey surveyed 500 European CMOs and found 3 urgent priorities: brand trust, ROI proof, and AI adoption. Here's how the Marketing Canvas Method operationalizes each one.

The 2026 Marketing Data Paradox — And the Framework That Solves It
72% of marketers can't turn data into insights. Funnel.io's 2026 research reveals a structural problem — and the Marketing Canvas Method is the decision architecture that solves it.

Why Your Competitive Position Determines Which Revenue Lever to Pull
Your M8/M9 perceptual map position is not just context — it is a hard constraint on what your revenue strategy can actually do. Choosing the wrong lever from the wrong position destroys value instead of creating it.